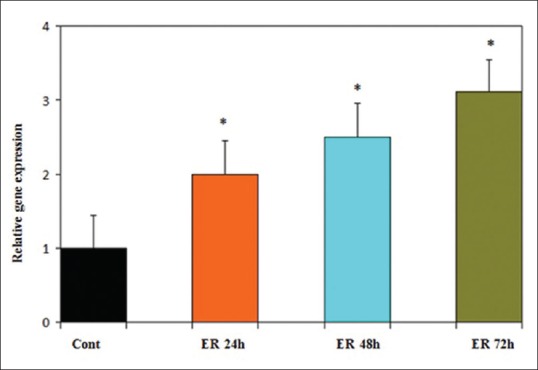
Figure 9.

Time course of estrogen receptor alpha (ERα) expression in PLC/PRF5 cells in response to genistein (GE) (25 μM). Quantitative reverse transcription polymerase chain reaction analysis demonstrated that GE increased ERα expression significantly. Asterisks (*) indicate significant differences between treated cells and the control group. Data are presented as means ± standard error of mean P < 0.006, n = 3
