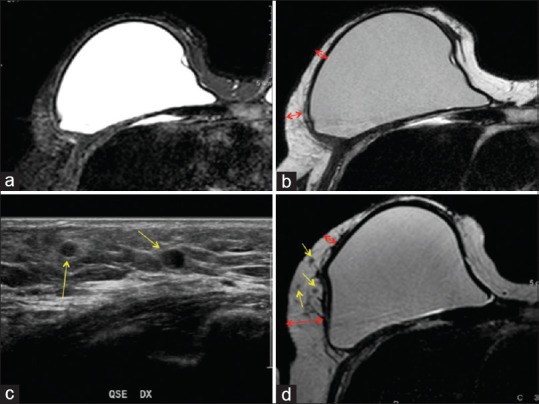
Figure 3.

Magnetic resonance imaging of a patient “responder” treated with fat grafting. T2 spectral attenuated inversion recovery imaging (a) and T2 imaging (b) of the preoperative situation. Arrows show the critical point of the reduced thickness and the local soft tissue defect characterized by a loss of volume. Ultrasound (c) of the postoperative situation after 1 year, the yellow arrows show the oil cysts in the soft tissue after 1 year later the fat grafting. T2 imaging (d) of the postoperative situation after 1 year. Red arrows show the improvement of the critical point and the increased thickness of the tissue; the yellow arrows show the oil cysts in the soft tissue after 1 year later the fat grafting
