. 2016 Aug 30;5:138. doi: 10.4103/2277-9175.187398
Copyright: © 2016 Advanced Biomedical Research
This is an open access article distributed under the terms of the Creative Commons Attribution-NonCommercial-ShareAlike 3.0 License, which allows others to remix, tweak, and build upon the work non-commercially, as long as the author is credited and the new creations are licensed under the identical terms.
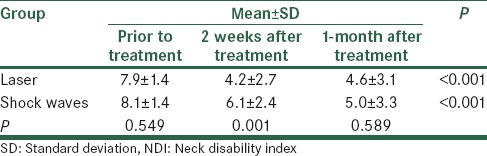
Table 1.
Average VAS for two study groups in various times