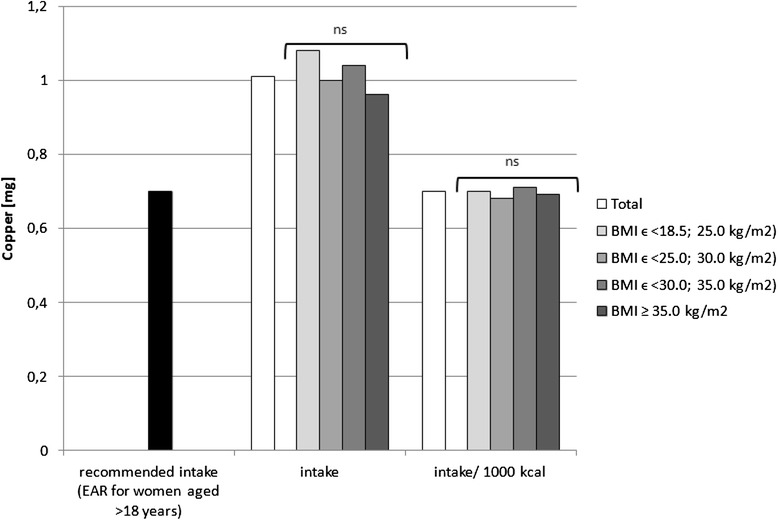
Fig. 8.

Recommended copper intake [34], accompanied by comparison between BMI groups of copper intake (p = 0.1660) and of copper intake per 1000 kcal of diet (p = 0.1936) between BMI groups, in analysed healthy women aged >55, RAC-OST-POL study, May 2010. EAR Estimated Average Requirement level, ns not significant differences
