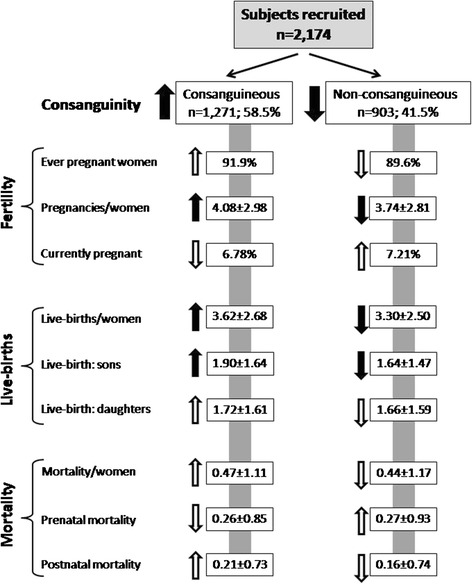
Fig. 2.

Flow chart showing the analyses scheme and the differentials in various parameters between consanguineous and non-consanguineous samples. Arrows in upward direction depict higher estimates in the respective sample and downward the lower estimates. Black arrows show that the differences in the distribution between the consanguineous and non-consanguineous samples were significant, while white arrows demonstrate non-significant distribution
