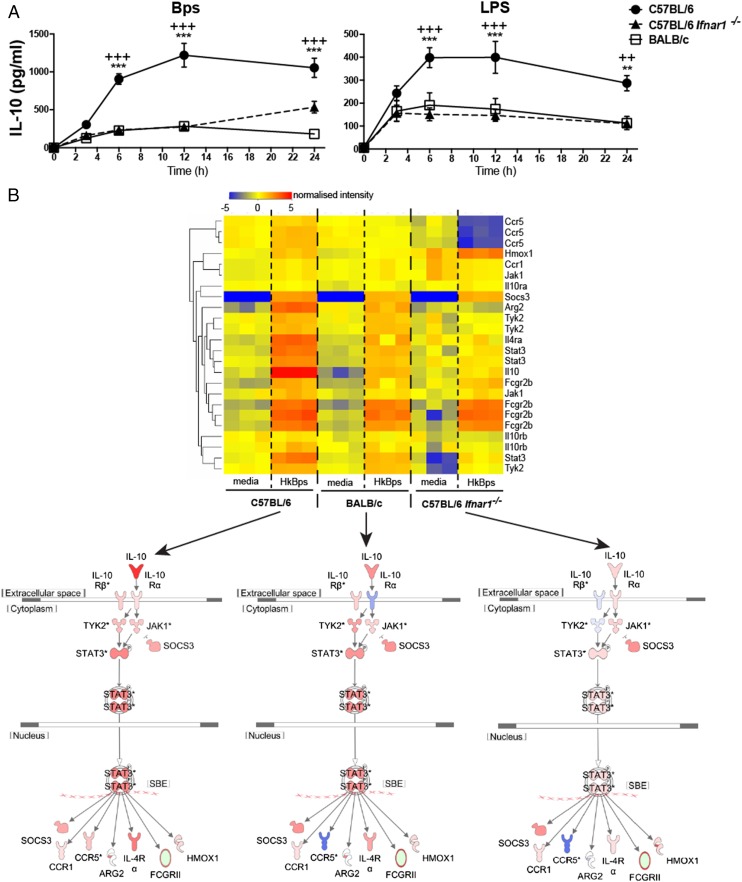
FIGURE 4.
B. pseudomallei– and LPS-stimulated C57BL/6 Ifnar1−/− and BALB/c macrophages have similar levels of IL-10 production and show reduced expression of IL-10 pathway genes compared with C57BL/6 WT macrophages. (A) C57BL/6, BALB/c, and C57BL/6 Ifnar1−/− BMDMs were stimulated with B. pseudomallei or LPS for the indicated times. IL-10 production was quantified by ELISA. Graphs show means ± SEM of four independent experiments. **p < 0.01, ***p < 0.001 as determined by two-way ANOVA (*C57BL/6 versus BALB/c; +C57BL/6 versus C57BL/6 Ifnar1−/−), Bonferroni multiple comparison test. (B) C57BL/6, BALB/c, and C57BL/6 Ifnar1−/− BMDMs were stimulated with B. pseudomallei for 6 h in triplicate cultures. Total RNA was isolated and processed for microarray analysis as described in Materials and Methods. Normalized expression of genes annotated within the IL-10 pathway (IPA) is shown hierarchically clustered according to expression. Lower panel shows overlay of gene expression level (red high, blue low) on a schematic of the IL-10 pathway (IPA).

