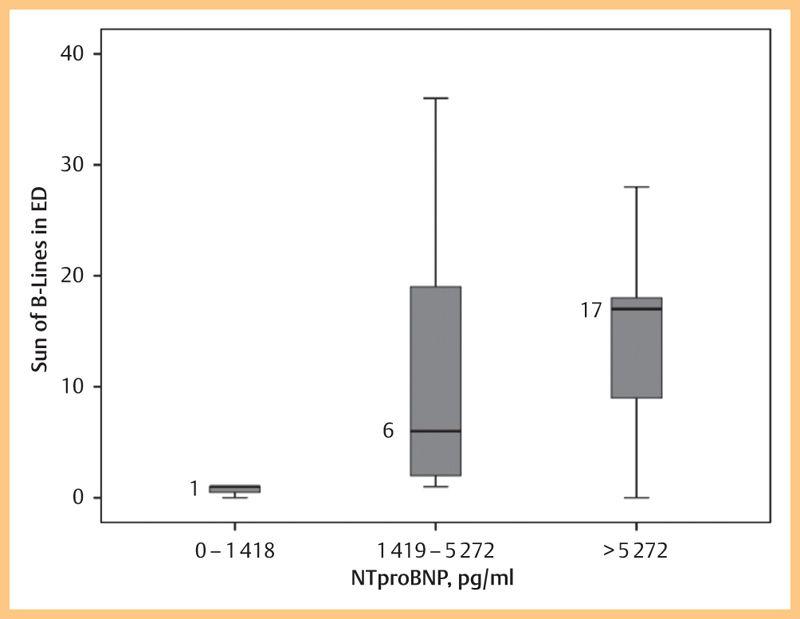
Fig. 1.

Boxplot of B-lines by different NT-proBNP groups in patients with acute dyspnea (n=14 patients in total with available NT-proBNP values). The graph shows a strong association among elevated NT-proBNP levels and the increased number of B-lines.
