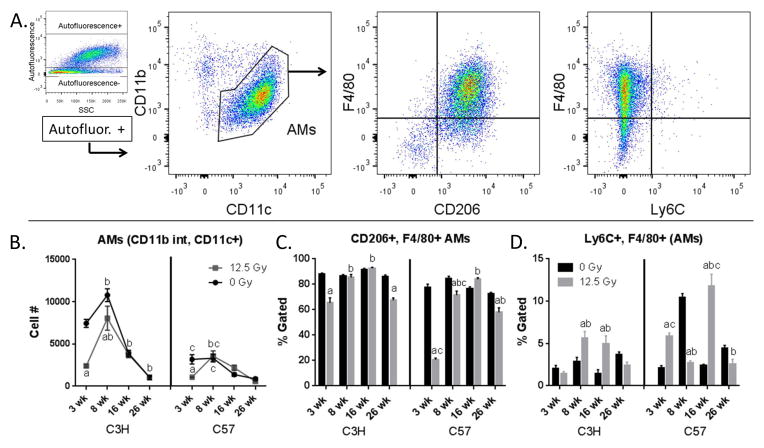
Figure 2.
Characterization of AMs. Lung cells from C3H and C57 mice, collected 3–26 wk following exposure of to 0 Gy or 12.5 Gy whole lung irradiation, were analyzed by flow cytometry. 2A: AMs were identified by first gating on autofluorescent+ cells in the CD45+, Ly6G− population and were identified as CD11b int and CD11c+. AMs were next analyzed for their expression of F4/80, Ly6C and CD206. One representative sample is shown. 2B: Radiation-induced alterations in AM cell number. 2C: Radiation-induced alterations in the proportion of CD206 and F4/80+ AMs. 2D: Radiation-induced alterations in the proportion of Ly6C+ and F4/80+ AMs. Each bar represents mean ± SEM (n = 3–4 mice/treatment group). aSignificantly different from age-matched controls. bSignificantly different from 3 wk time point (controls only). cSignificantly different from C3H mice.

