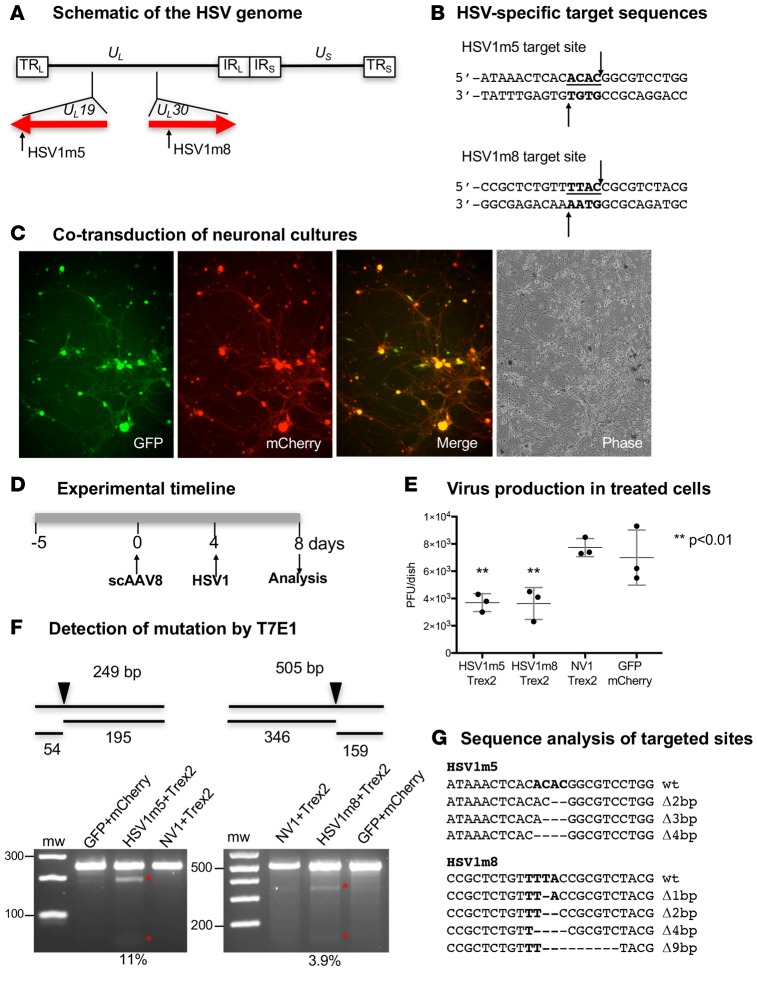
Figure 1. Impact of HSV-specific HE exposure on HSV replication in neuronal cultures.
(A) Schematic representation of the HSV-1 genome. The long terminal and internal repeats (TRL and IRL), and the internal and terminal short repeats (TRS and IRS), bordering the unique long (UL) and unique short (US) regions are shown. The location of the target sequences recognized by HSV1m5 in the UL19 gene and HSV1m8 in the UL30 gene are indicated. (B) The sequences recognized by HSV1m5 and HSV1m8 are shown. The 4 nucleotides constituting the 3′ overhang generated by HE cleavage are bold and underlined. Arrows indicate enzyme target or cleavage sites. (C) Fluorescence images of neuronal cultures taken at 7 days after cotransduction with scAAV8-sCMV-GFP and scAAV8-sCMV-mCherry at an MOI of 1 × 10⁶ vg/AAV/neuron. Representative GFP, mCherry, merged GFP/mCherry, and phase images are shown. Magnification 100×. (D) Schematic of the experimental timeline. Triplicate neuronal cultures were established from dissociated murine TGs and cotransduced with 2 scAAV8 vectors expressing HSV1m5 and Trex2, HSV1m8 and Trex2, NV1 and Trex2, or GFP and mCherry at a MOI of 1 × 10⁶ vg/AAV/neuron. At 4 days after AAV transduction, cultures were infected with HSV-1 FΔUS5 at an MOI of 1 PFU/neuron for 4 additional days. (E) Virion release in culture media was quantified by plaque assay titration. The mean ±SD of triplicate wells is indicated. The P value was calculated using a 1-sided t test. (F) Mutagenic event detection by T7E1 assay. Schematic representation of PCR amplicon with full-size and T7 endonuclease cleavage product sizes indicative of HSV-specific HE cleavage and mutagenesis. The arrow indicates the location of the HE target site in the PCR product. The HSV regions containing the target site were PCR amplified from total genomic DNA obtained from pooled triplicate dishes and subjected to T7E1 digestion before separation on a 3% agarose gel. mw, molecular weight size ladder; red asterisks indicate cleavage products. The relative mutation frequency was determined using ImageJ. (G) Target site–containing PCR amplicons were cloned and sequenced from individual bacterial colonies. Δ, deletion. Bold indicates the 4 nucleotides constituting the 3′ overhang generated upon HE target site cleavage.

