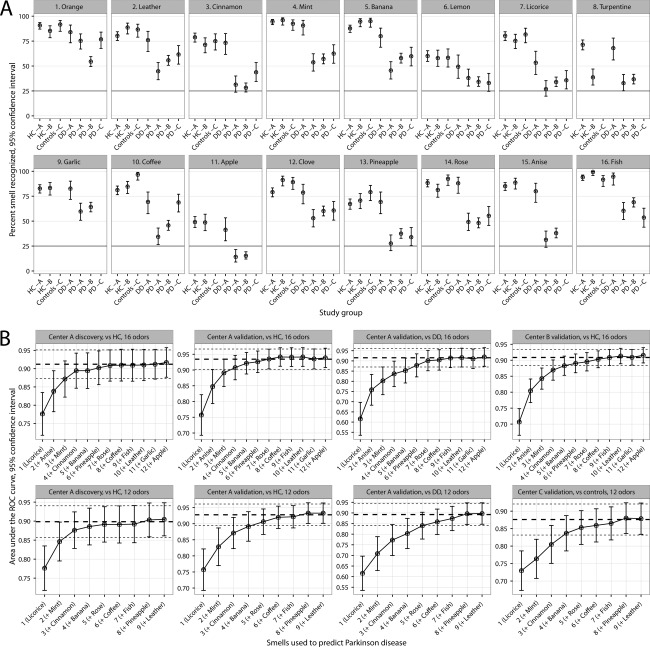
Figure 1.

Identification of individual odors in the study groups in the three different centers (A). Gray horizontal line indicates the probability of correctly guessing an odor in the employed forced choice test. AUCs with 95% CIs as a function of combination of odors best predicting PD according to the LASSO analysis in the various cohorts (B). The three horizontal lines in each graph represent the AUCs with 95% CIs of the full test used (SS‐16 for the upper row and SS‐12 for the lower row). The best eight discriminating odors derived from the full SS‐16 were used for the SS‐8 subscore (licorice, anise, mint, cinnamon, banana, pineapple, rose, and coffee).
