Figure 3.

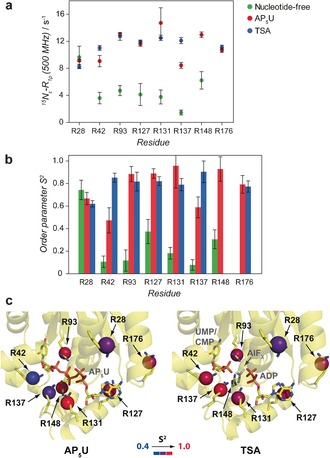
a) Relaxation rates in the rotating frame, R 1ρ(15Nϵ), for UmpK arginine side‐chains in the nucleotide‐free form (green), AP5U complex (red) and TSA complex (blue). For the TSA complex the relaxation rates were derived from the 1H‐detected experiments, for the AP5U complex the rates were derived from both the 13C‐detected and the 1H‐detected experiments, whereas for the nucleotide‐free form the rates were derived from 13C‐detected experiments only (Supporting Information). b) Order parameters S 2, describing pico‐nanosecond motions of UmpK arginine side‐chains in the nucleotide‐free form (green), AP5U complex (red) and TSA complex (blue), were obtained from global analyses of the available 15Nϵ relaxation data (Table S2) using the model‐free approach.13 c) Conformational heterogeneity of UmpK arginine side‐chains in the AP5U complex (left) and in the TSA complex (right). The order parameters S 2 shown in (b) were mapped on the respective crystal structures (AP5U, PDB: 1UKE;11 TSA, PDB: 3UKD7). All parameters obtained from the global analysis of the relaxation data are given in Table S3.
