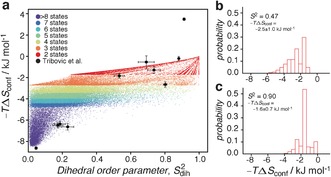
Figure 4.

a) Simulated conformational entropy versus side‐chain order parameter, obtained at a temperature of T=298 K and for the simulation described in the Supporting Information. The data are colored according to how many states are sampled of the 34 possible arginine side‐chain rotamer states.[17] Shown are 80 000 randomly selected data points out of the totally 8×10⁶ obtained. Included as black points are the correlations obtained previously from MD simulations of RNaseH16 (see Supporting Information). b) Histogram showing the distribution of conformational entropies for an order parameter of 0.46<S 2<0.48. c) Histogram showing the distribution of conformational entropies for an order parameter of 0.89<S 2<0.91. In (b) and (c) all 8×10⁶ points were used.
