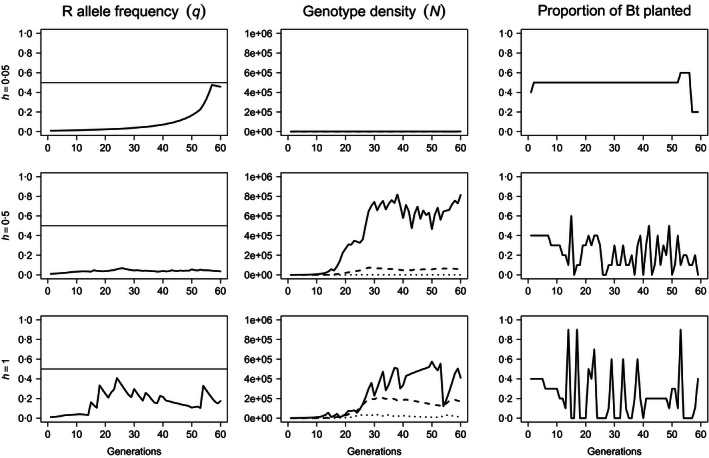
Figure 4.

Resistance allele frequency (left‐most column), genotype abundance (central column) and proportional allocation of space to Bt crops (right‐most column) over T = 60 generations when resistance is associated with a 25% reduction in fecundity (λrr = 0·75λss). Density dependence is undercompensating (β = 1) and uniform. The dominance of resistance was increased from h = 0·05 (top row), to h = 0·5 (centre row) and h = 1 (bottom row). The solid horizontal lines (left) are the critical allele frequency, q c = 0·5. On plots of genotype‐specific density, solid lines represent susceptible homozygotes (ss), dashed lines represent heterozygotes (sr) and dotted lines represent resistant homozygotes (rr). N 0 = 1000 and q 0 = 0·01.
