
Figure 6.
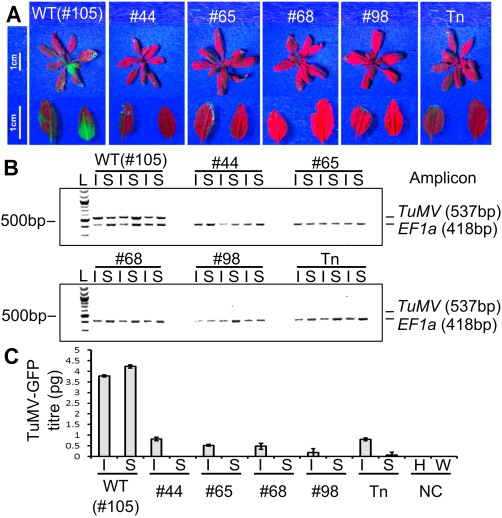
(A) Representative photographs of TuMV‐GFP (green fluorescent protein‐expressing Turnip mosaic virus clone)‐infected plants imaged under UV light at 7 days post‐infection. A transposon‐induced eIF(iso)4E mutant (Tn) was used as a resistant control. Enlarged images of inoculated (left) and systemic (right) leaves are shown below each rosette. (B) Reverse transcription‐polymerase chain reaction (RT‐PCR) to detect the presence of TuMV‐GFP in inoculated (I) and systemic (S) leaves for each genotype. Three separate plants were analysed per genotype. The first two lanes for each genotype correspond to the leaves imaged in (A). Amplicons of the TuMV coat protein region (537 bp) and the house‐keeping gene EF1a (418 bp) were PCR amplified separately from the same cDNA, mixed and run together on a 2% agarose gel. L denotes a 100‐bp DNA ladder. TuMV‐specific amplicons are clearly visible in each of the wild‐type (WT) samples, but completely absent from any of the eIF(iso)4E mutant samples. (C) Quantitative RT‐PCR to detect the mean absolute viral titre (in picograms) for the samples shown in (A) and (B). Quantitative RT‐PCRs were performed with cDNA from a healthy plant (H) and water (W) as negative controls (NC). Error bars show the standard error of the mean (SEM) of three biological replicates.