Figure 1.
Transcriptomics and genetic alteration analyses of cytoskeleton regulators.
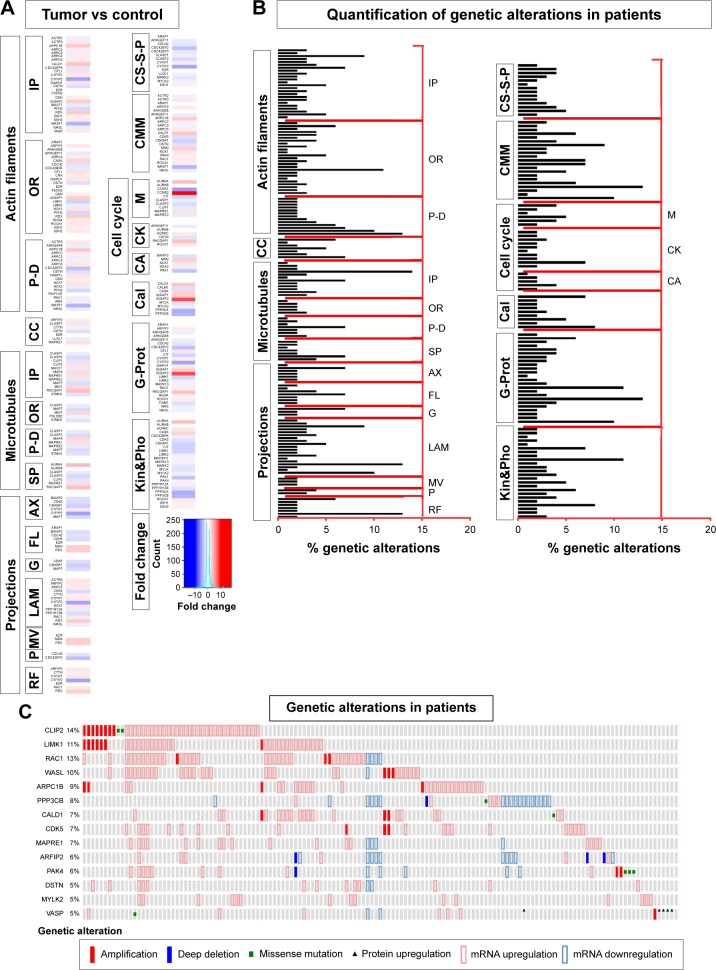
Notes: (A) Transcriptomics data shown as a color code, representing fold change in expression of 85 cytoskeletal regulators grouped into ten groups with abbreviated subgroups, in tumor tissue compared to corresponding organ-specific controls. The majority of the genes analyzed exhibited differential gene expression in favor of the tumor tissue. (B) Quantification of total genetic alterations in these 85 genes grouped into ten groups with abbreviated subgroups, obtained by querying 291 patient samples from the TCGA data set. Each gene is shown by a horizontal bar graph with their percentage of genetic alteration shown on the x-axis. (C) Summary of 14 genes with high genetic alteration. Each column represents a unique patient sample.
Abbreviations: TCGA, The Cancer Genome Atlas; IP, interacting proteins; OR, organizing and biogenesis; P-D, polymerization or depolymerization; CC, cortical cytoskeleton; SP, spindle organization and biogenesis; AX, axon and dendrites formation; FL, filopodia; G, growth cones; LAM, lamellipodia; MV, microvilli; P, pseudopodia; RF, ruffles; CS-S-P, cell shape–size–polarity; CMM, cell motility or migration; M, mitosis; CK, cytokinesis; CA, cytoskeleton adaptors; Cal, calmodulins and calcineurins; G-Prot, G-protein signaling; Kin&Pho, kinases and phosphatases.

