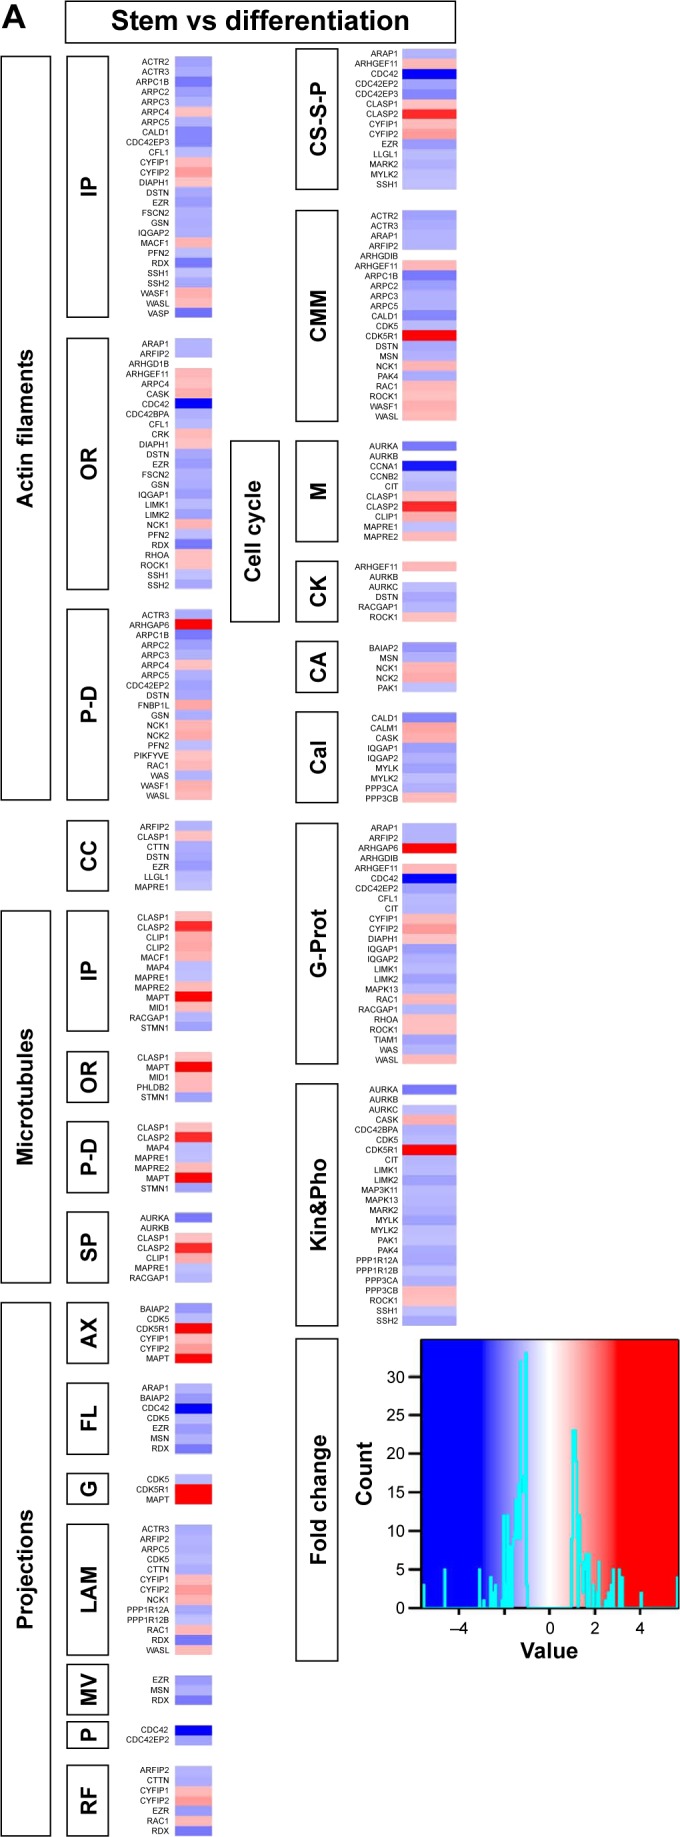
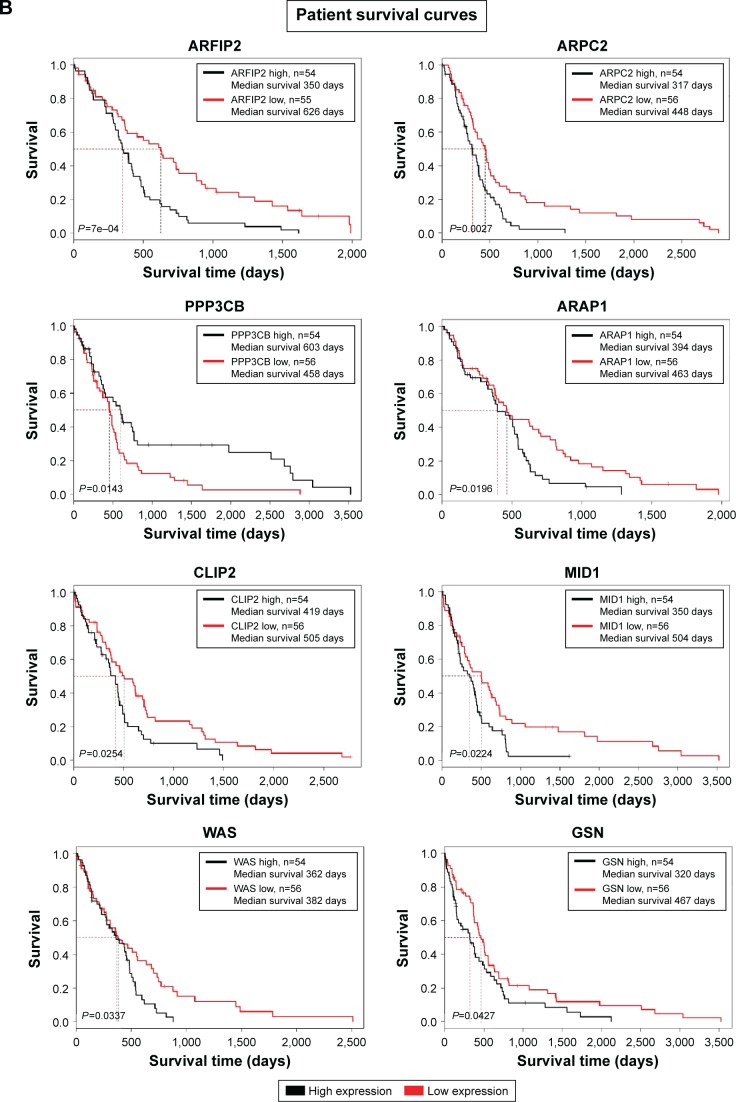
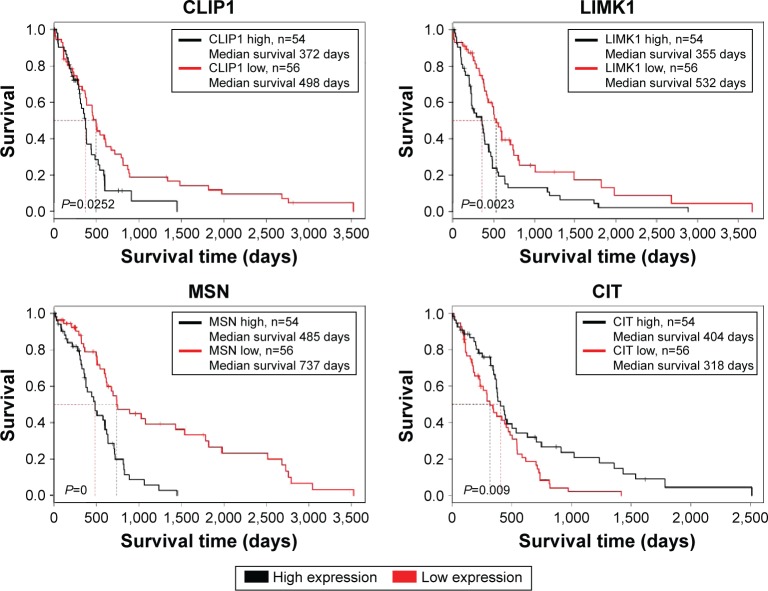
Figure 3.

Transcriptomics and patient survival plots of cytoskeletal regulators.
Notes: (A) Heat map displaying fold change in gene expression for the genes grouped as ten groups with abbreviated subgroups and analyzed between GBM stem-like cells and GBM cells subject to differentiation. (B) Patient survival plots of 12 genes with high statistical significance based on high or low expression of the genes.
Abbreviations: GBM, glioblastoma multiforme; IP, interacting proteins; OR, organizing and biogenesis; P-D, polymerization or depolymerization; CC, cortical cytoskeleton; SP, spindle organization and biogenesis; AX, axon and dendrites formation; FL, filopodia; G, growth cones; LAM, lamellipodia; MV, microvilli; P, pseudopodia; RF, ruffles; CS-S-P, cell shape–size–polarity; CMM, cell motility or migration; M, mitosis; CK, cytokinesis; CA, cytoskeleton adaptors; Cal, calmodulins and calcineurins; G-Prot, G-protein signaling; Kin&Pho, kinases and phosphatases.


