Figure 5.
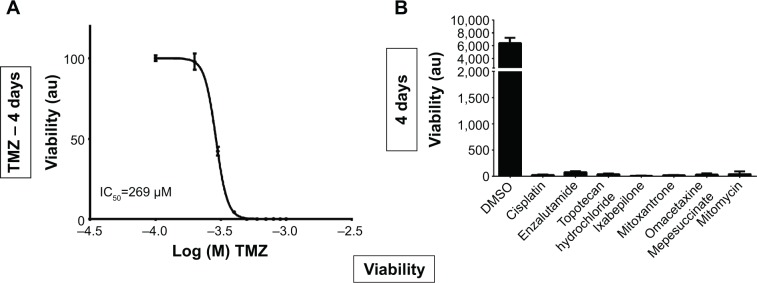
Cell viability analyses of temozolomide and other compounds.
Notes: (A) Log dilution series, in molar concentrations (M) of temozolomide (TMZ) and its effect on cell viability measured at day 4. The IC50 values are represented as an inset in the graph. (B) Cell viability measurement of small molecules producing the highest effect on GBM cells after 4 days of treatment at 10 μM final concentration. Error bars are represented as standard deviation. (A) Log dilution series, in molar concentrations (M) of temozolomide (TMZ).
Abbreviations: IC50, half maximal inhibitory concentration; GBM, glioblastoma multiforme; DMSO, dimethyl sulfoxide.

