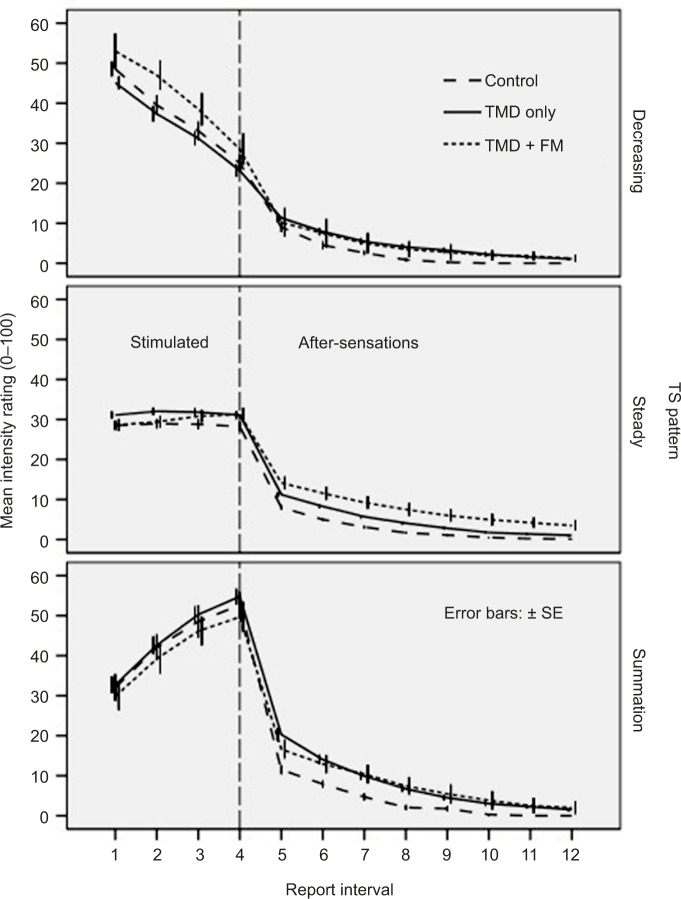
Figure 4.
Mean ± SE numerical rating scale reports during the TS and AS phases of response.
Notes: Different lines show responses in each clinical group for each of the three response patterns, decreasing, steady, and summating trials. The vertical line separates the four reports given during the stimulation period (TS) from the eight AS. AS appear elevated in both case groups when stimulation produced steady state or summating patterns.
Abbreviations: AS, after-sensations; FM, fibromyalgia; SE, standard error; TMD, temporomandibular disorders; TS, temporal summation.

