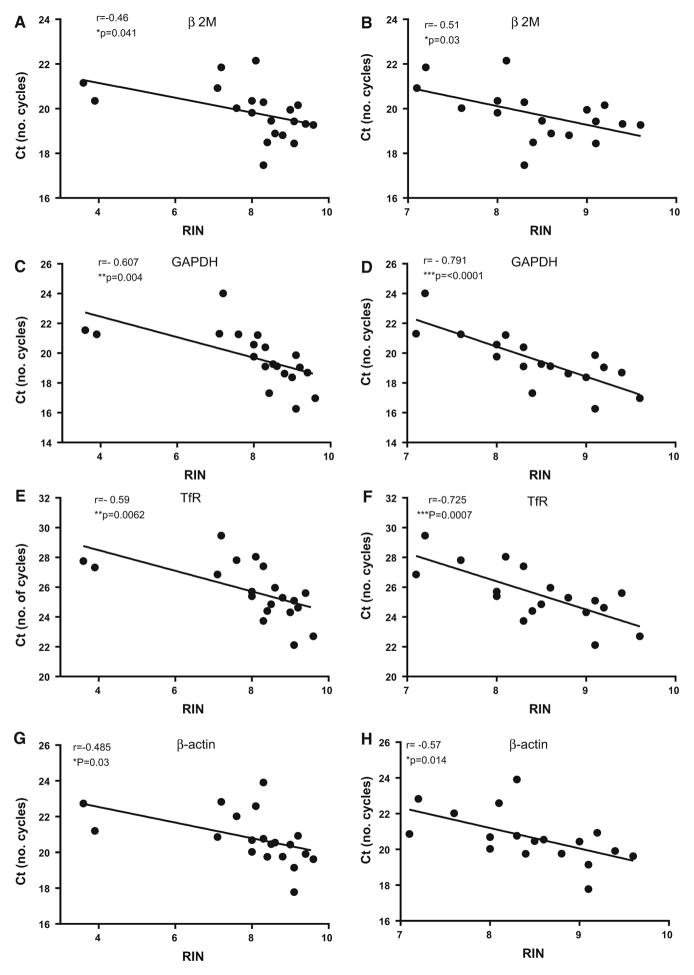
Fig. 3.
Effect of RIN on expression values of housekeeping normalization genes in RNA samples derived from heart. The results show linear correlation analyses for Ct values compared to RIN values for the genes β2 microglobulin (β2 M) (a and b), glyceraldehyde-3 phosphate dehydrogenase (GAPDH) (c and d), transferrin receptor (e and f), and β-actin (g and h). Results on left show analyses for these genes using the samples with complete range of RIN values (a, c, e, g), while the panels on right side show matching analyses for samples with RIN values meeting the criteria of>6.5 (b, d, f, h). In both cases, significant correlation of Ct values with RIN was shown

