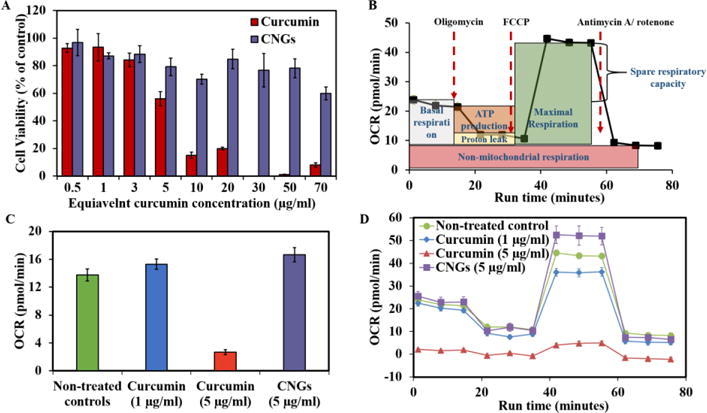
Figure 3. Dose dependent cytotoxicity of CNGs towards HUVECs after 24 hours of treatment and comparison with free curcumin.

(A) Cell viability calculated after carrying out Calcein AM red-orange live cell tracer assay (B) Mitochondrial oxygen consumption rate profile of a typical mitochondrial stress assay conducted using Seahorse XF96 instrument. (C) Basal respiration rates of curcumin and CNGs represented at pmol/min after the calculations as depicted in Figure 3A. N=5 replicates were used for each group. (D) OCR (profile) of the controls and free curcumin or CNG at different curcumin concentrations in response to mitochondrial stress assay reagents added in a series at selected time points. Error bars: (A) – std. dev.; (C), (D) – std. err.
