Figure 3.

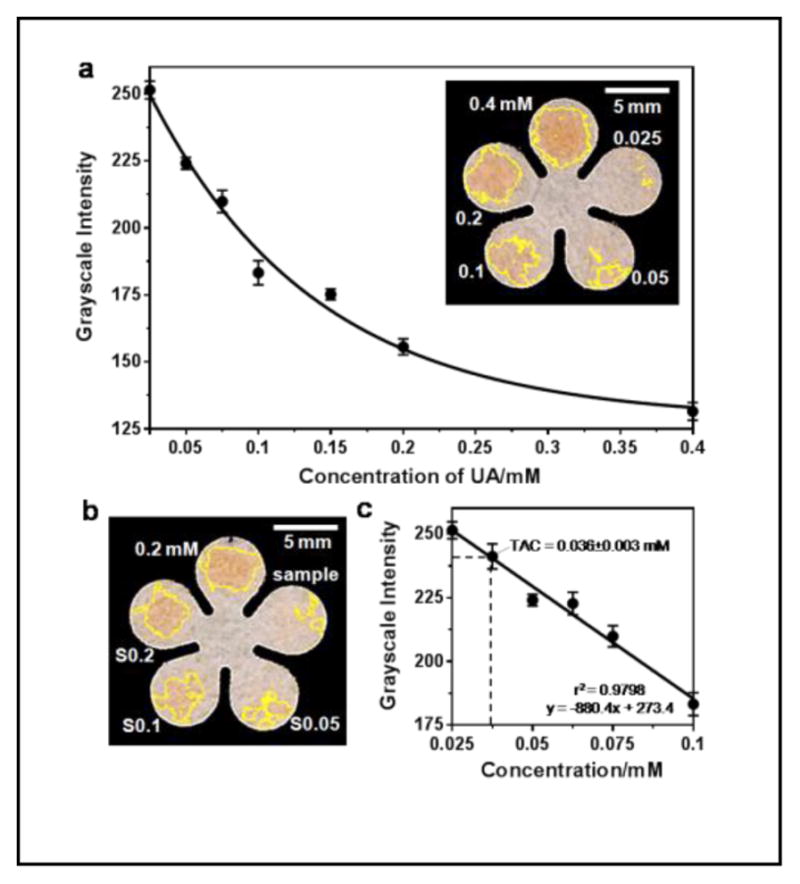
Quantitation of TAC in mouse plasma on cPADs. (a) Standard curve of UA ranged from 0.025 to 0.4 mM (n = 7). The inset image shows an example of an assay in which 0.5-μL of a standard solution of 0.4, 0.2, 0.1, 0.05 and 0.025 mM UA was applied to the cPAD. (b) Test of TAC in a plasma sample isolated from diluted C57BL/6 male mouse blood. The accuracy of the TAC measurement was verified by spiking UA standard in three different concentrations: S0.05, S0.1 and S0.2 represent mixtures of plasma samples with 0.05, 0.1, and 0.2 mM UA at a volume ratio of 1:2 respectively. “0.2 mM” indicates the concentration of a UA standard. (c) Calibration curve in linear range of (a) indicating the measured TAC in mouse plasma (n = 6 samples).
