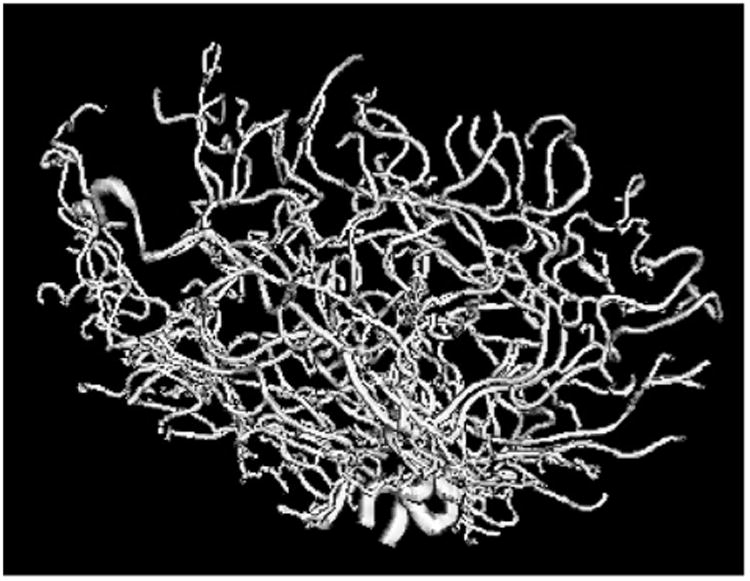
Fig. 1.

Tree of arteries from the brain of one person, showing one data object. Thickest arteries appear near the bottom. Arteries bend, twist and branch through three dimensions, which results in meaningful aspects of the data being captured by persistent homology representations. The resolution is 0.5 × 0.5 × 0.8 mm3.
