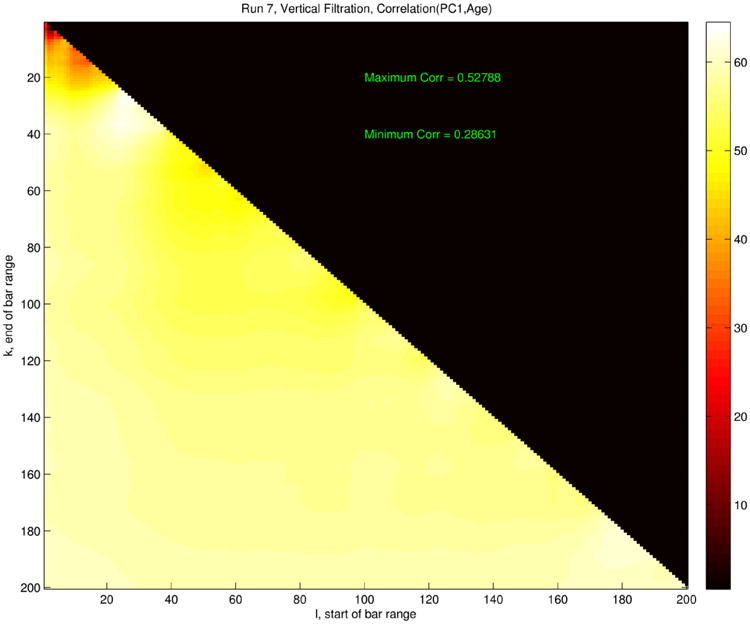
Fig. 12.

Age correlation heat map for features extracted from zero-dimensional persistent homology analysis. Color indicates the value of the function ρ(n, N), which is the age correlation derived from the vectors pn,N, with n on the horizontal axis and N on the vertical. The upper-right black triangle is meaningless, as n > N does not lead to a vector in our scheme.
