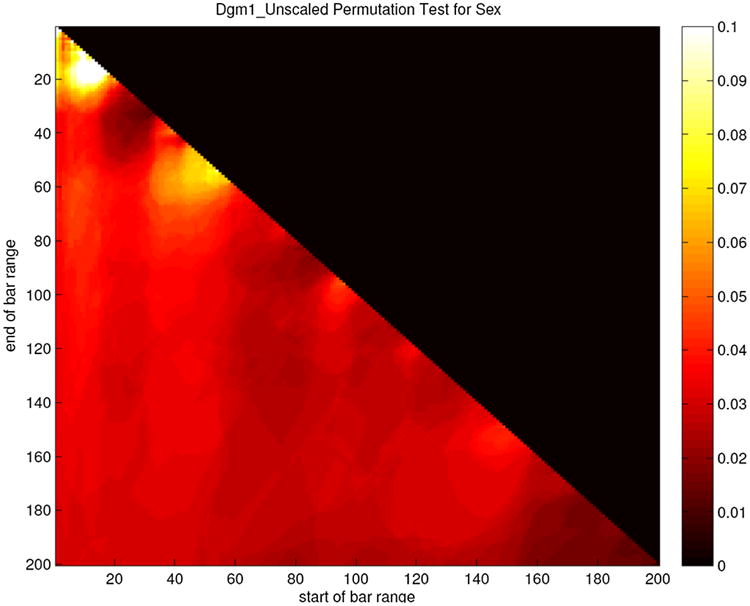
Fig. 13.

Sex-difference significance heat map for features extracted from one-dimensional persistent homology analysis. Color indicates the value of the function p(n, N), which is the significance, derived via permutation test, of the difference between the male and the female vectors qn,N, with n on the horizontal axis and N on the vertical. The upper-right black triangle is meaningless, as n > N does not lead to a vector in our scheme. To provide good contrast between the values, a color scheme running from 0.1 (white) to 0 (black) was chosen. A few values are actually above 0.1 and are simply shown as white in this scheme.
