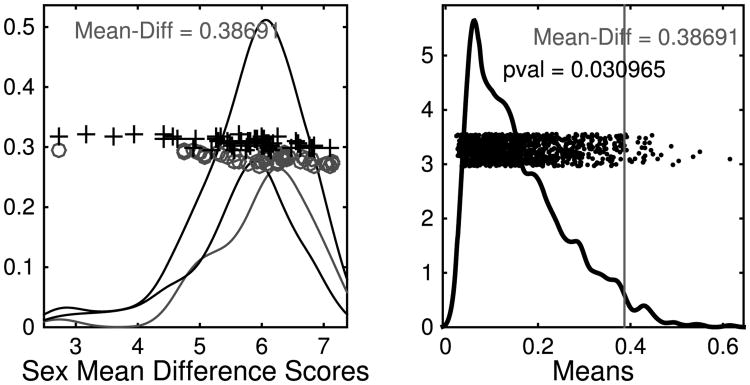
Fig. 5.
Illustration of DiProPerm results on the one-dimensional persistence features. The left panel shows the result of projecting the data onto the direction vector determined by the means, suggesting some difference. The results of the permutation test are shown on the right, with the proportion of simulated differences that are bigger than that observed in the original data giving an empirical p-value.

