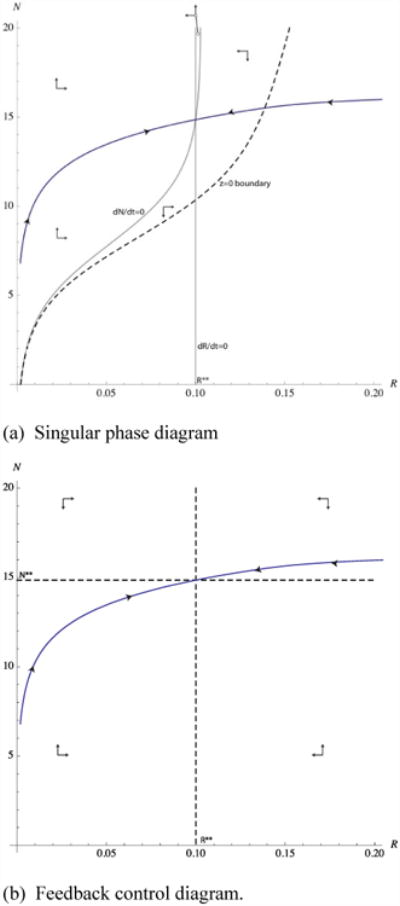
Figure 1.

In both panels, background risk is on the horizontal axis and prevention stock (in billions of US dollars) on the vertical axis. In Panel (a), the plane is partitioned by the dashed line (z(R,N)=0) into a positive prevention area above the dashed line, and the area where no prevention is optimal, below the dashed line. The two grey lines trace out the singular isoclines. The singular path is blue and shown with arrows indicating the direction of movement along the path. Arrows indicate directions of movement for the singular path. Panel (b) illustrates the MRAP directions of movement and the singular path.
