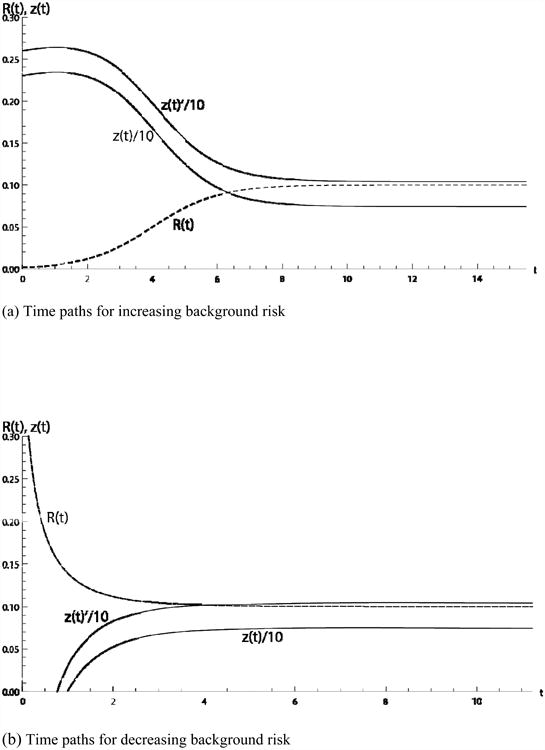
Figure 3.

The comparative dynamic results for an increase in JX are shown above, where JX is greater along the z(t)′ curves. Panel (a) shows the comparative dynamic results for the path of investment in prevention for the increasing background risk case, scaled in (billions of US dollars)/10 (solid line), and the background risk as it increases to R** (dashed line) Panel (b) shows the same variables for the decreasing risk case in the interval when z(t)>0. Only investment in prevention shifts, upward from z(t) to z′(t) as the value of JX falls and the disease becomes more damaging.
