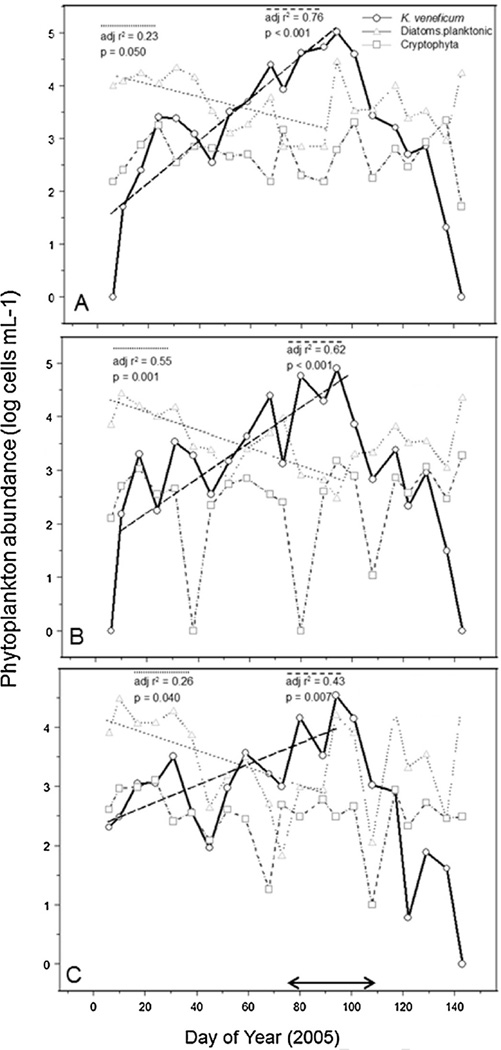
Fig. 6.
Time series plots of K. veneficum, planktonic diatoms, and cryptophytes for the period spanning the 2005 K. veneficum bloom at three SRE sites, (A) SUC, (B) KIN, (C) RON. The double arrow along the X-axis of (C) indicates the time period of the K. veneficum bloom and fish kill. Regression lines and statistics are shown for K. veneficum and planktonic diatoms, whereas trends for cryptophytes were not significant.

