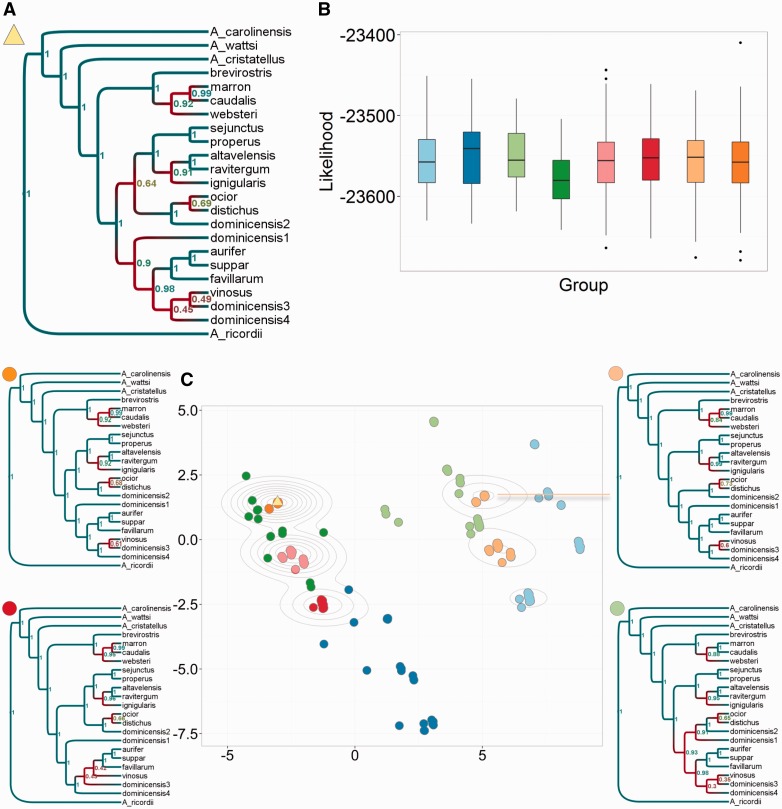
Fig. 3.
Identifying and exploring islands in anoles *BEAST trees. (A) MCC tree for the whole posterior. (B) Boxplots of the *BEAST log-likelihood scores of the sampled trees, separated and colored by cluster. The log-likelihood distributions were comparable for each cluster. (C) MDS plot of 1,000 trees from the posterior, colored according to eight clusters found using k-means clustering. Four examples of an MCC tree for an individual cluster are given here. A more visually dispersed cluster corresponds to more uncertainty in larger clades. The relatively small number of points in the plot () corresponds to the small number of distinct topologies explored; density of points is illustrated with contour lines.

