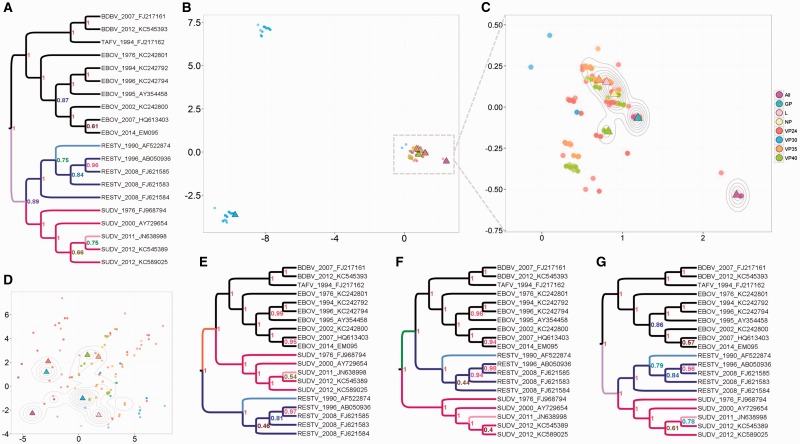
Fig. 4.
Ebolavirus comparison of individual and “all” gene trees. (A) MCC tree from “all” (purple triangle). (B) MDS plot of 1,200 trees (150 per type), showing three distinct groups of topologies for VP30. (C) A closer look at the largest group from B. The MCC tree per gene is marked as a triangle. The MCC trees for GP and VP24 are plotted in almost the same position, in the center of the largest group among individual gene trees. The distance between them is , the minimum distance by our metric. (D) MDS plot of all 1,200 trees using the RF metric. Distinct VP30 topologies are not detected, in fact, the VP30 MCC tree is identical to the NP MCC tree according to RF because it is an unrooted metric. (E–G) MCC tree from lower left VP30 cluster, upper left VP30 cluster, and main cluster, respectively. The MCC tree from the largest cluster, G, is naturally more similar to A than to E or F.

