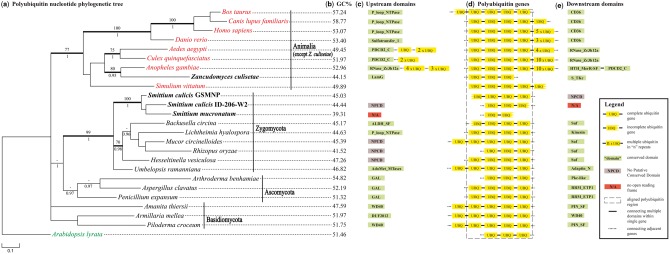
Fig. 2.
Phylogenetic and syntenic analyses of polyubiquitin nucleotide sequences. (a) Phylogenetic tree of polyubiquitin nucleotide sequences derived from the Bayesian analysis; MLBP ≥ 70% are shown above branches, whereas BPP ≥ 0.95 are shown below branches. Branches significantly supported by both are in bold. Animal taxa are noted in red, the outgroup in green, fungi in black, with Harpellales in bold. (b) GC ratios of the aligned polyubiquitin genes. (c–e) The aligned polyubiquitin gene region and adjacent domains. Regions inside the dotted box were included in the phylogenetic analyses.

