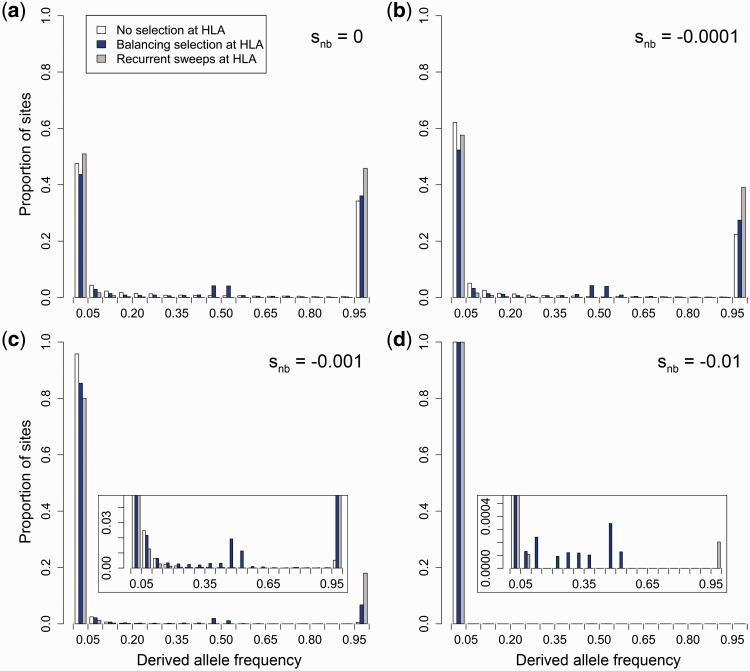
Fig. 3.
Simulated site frequency spectrum of variants surrounding the HLA gene under different selection scenarios. Derived allele frequencies along the regions around an HLA gene are derived from simulations with three different selection scenarios on the HLA gene (white: no selection on HLA, blue: balancing selection, gray: recurrent sweeps of positive selection). Variants in neighboring regions evolved (a) neutrally (snb = 0) or under codominant purifying selection with (b) snb = −0.0001, (c) snb = −0.001, or (d) snb = −0.01, respectively. Note the different y axis scales in the zoomed insets of panels (c) and (d) for better visualization.

