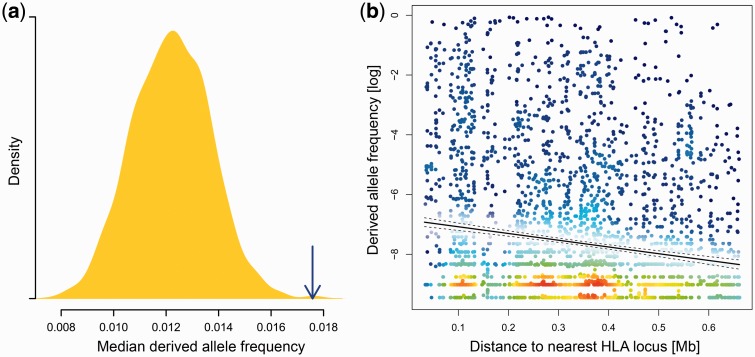
Fig. 5.
Observed distribution of derived allele frequencies. Derived alleles are defined as the nonreference allele at polymorphic sites in the Exome Sequencing Project data. (a) The median frequency of derived alleles per gene is averaged over the 113 genes represented in the MHC region (blue arrow, excluding classical HLA genes). The yellow density curve shows the distribution of equivalent values for 1,000 Monte Carlo-sampled sets of 113 random genes from the entire exome. (b) Derived allele frequency at polymorphic sites (N = 4,175) in the MHC region is shown in relation to distance to the nearest classical HLA locus. Solid and dashed lines indicate linear fit and 95% confidence intervals, respectively. Color shading indicates local data point density for improved visualization of the extent of overlapping points in the plot, ranging from blue (low density) via green and yellow to red (high density).

