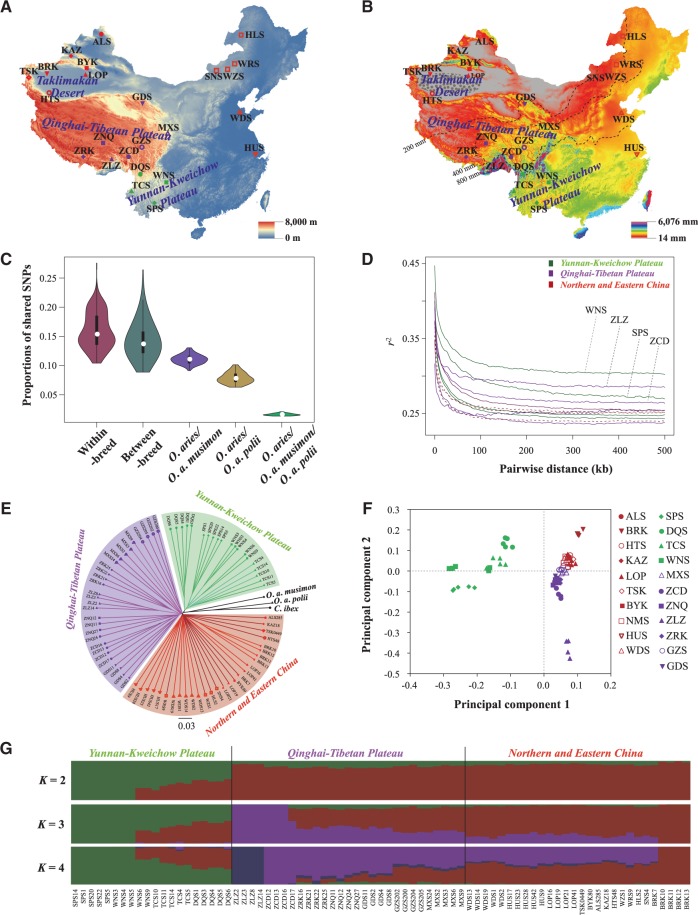
Fig. 1.
Geographic distribution and population genetics analyses of 21 native sheep breeds. (A) Sampling sites in this study. A total of 77 Chinese sheep representing 21 native breeds were included. The elevation (m) of the study area is also visualized. (B) Geographic variation of the annual mean precipitation (mm). Precipitation data during the 21 years from 1981 to 2001 were retrieved from the Abdus Salam International Center for Theoretical Physics, Italy (ICTP, https://www.ictp.it, last accessed January 5, 2015). The 200, 400, and 800 mm average annual precipitation lines are also visualized. (C) Diagram of the average shared SNPs between O. aries individuals as well as between O. aries individuals and the individuals of the three wild species (O. a. musimon, O. a. polii, and C. ibex). (D) Decay of linkage disequilibrium (LD) in the Chinese native sheep breeds, with one line per breed. (E) NJ tree constructed using p-distances between individuals. The three wild species are used as outgroups. (F) Principal components 1 and 2 for the 77 native sheep. (G) Population genetic structure of the 77 native sheep inferred from the program FRAPPE v1.1. The length of each colored segment represents the proportion of the individual genome inferred from ancestral populations (K = 2–4). See supplementary table S1, Supplementary Material online for the abbreviations of the breeds and individuals.

