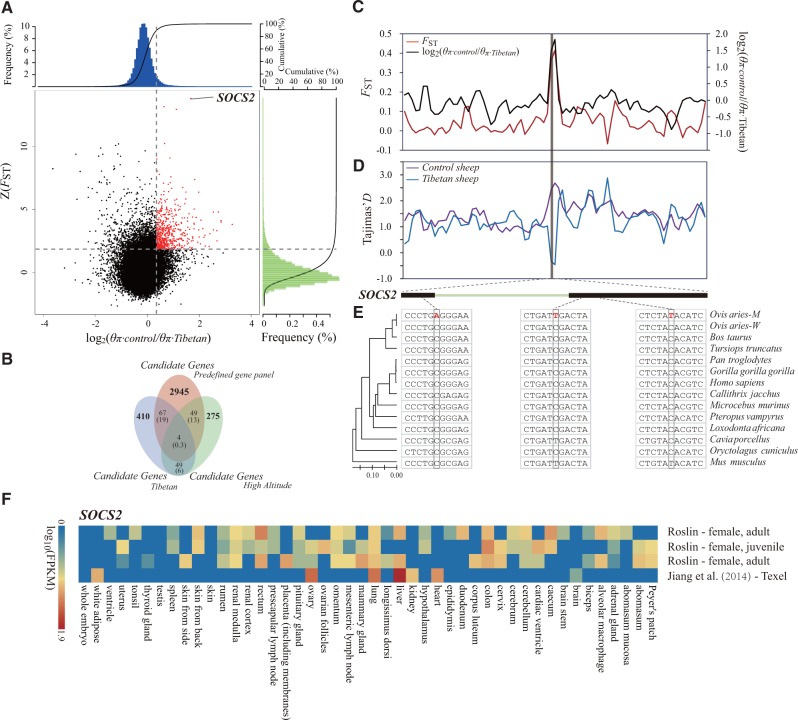
Fig. 3.
Genomic regions with strong selective signals in Tibetan sheep. (A) Distribution of log2(θπ ratios) and Z(FST) values calculated in 100-kb sliding windows with 50-kb increments between Tibetan group (including breeds ZNQ, ZCD, and ZRK from the plateau environment) and control group (including breeds HUS and WDS from East China). The data points in red (corresponding to the top 5% of the empirical log2(θπ ratios) ratio distribution with values >0.35 and the top 5% of the empirical Z(FST) distribution with values >1.83) are genomic regions under selection in Tibetan sheep. (B) Comparison between the overlap of candidate genes and the overlap expected by chance. Numbers in the intersection regions are the observed overlapping genes among the candidate genes in Tibetan sheep, sheep breeds from the high-altitude regions and the predefined gene panel (i.e., the previously published candidate genes in other mammalian species under the high-altitude environment, including human, dog, wolf, yak, pig, and Tibetan antelope). Numbers in parentheses show the number of genes expected by chance. The total numbers of genes for the sheep and the gene panel involved in the test are 18,013 and 65,029, respectively. (C) log2(θπ ratios) and FST values around the SOCS2 locus. The black and red lines represent the log2(θπ ratios) and FST values, respectively. (D) Tajima’s D values around the SOCS2 locus. The blue and purple lines represent the Tibetan sheep and control sheep, respectively. (E) Evolutionary analysis of the SOCS2 gene. The inter-species NJ tree is derived from the 12 vertebrate orthologous sequences, and the mutations are marked in red. O. aries M., namely O. arise mutant, represents Tibetan sheep in which the mutations were observed. O. aries W., namely O. aries wild, refers to other sheep breeds in which the nucleotides were conserved. (F) Gene expression of SOCS2 in different sheep tissues is based on four different experiments deposited in the EBI Gene Expression Atlas database. The FPKM (fragments per kilobase of transcript per million mapped reads) value is used to measure the expression level.

