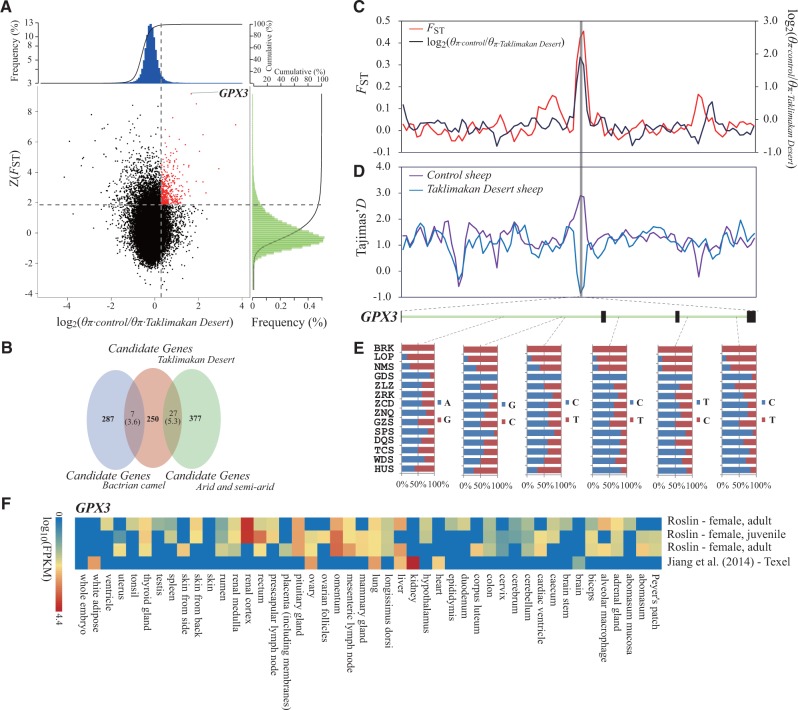
Fig. 4.
Genomic regions with strong selective signals in sheep breeds from the Taklimakan Desert region. (A) Distribution of log2(θπ ratios) and Z(FST) values calculated in 100-kb sliding windows with 50-kb increments between Taklimakan Desert group (including breeds LOP and BRK from the desert environment) and control group (including breeds HUS and WDS from East China). The data points in red (corresponding to the top 5% of empirical log2(θπ ratios) ratio distribution with values >0.28 and the top 5% of empirical Z(FST) distribution with values >1.86) are genomic regions under selection in the sheep breeds from the Taklimakan Desert region. (B) Comparison between the overlap of candidate genes and the overlap expected by chance. Numbers in the intersection regions are the observed overlapping genes among the candidate genes in sheep breeds from the Taklimakan Desert region, sheep breeds from the arid regions and the predefined gene panel (i.e., the previously published candidate genes in other mammalian species under the arid environment, including Bactrian camel). Numbers in parentheses show the number of genes expected by chance. The total numbers of genes for sheep and Bactrian camel involved in the test are 18,013 and 20,251, respectively. (C) log2(θπ ratios) and FST values around the GPX3 locus. The black and red lines represent log2(θπ ratios) and FST values, respectively. (D) Tajima’s D values around the GPX3 locus. The blue and purple lines represent the Taklimakan Desert sheep and control sheep, respectively. (E) Allele frequencies of six SNPs within the GPX3 gene across Chinese native sheep breeds. The desert breeds include BRK and LOP, whereas the non-desert breeds comprise all other breeds. (F) Gene expression of GPX3 in different sheep tissues is based on four different experiments deposited in the EBI Gene Expression Atlas database. The FPKM (fragments per kilobase of transcript per million mapped reads) value is used to measure the expression level. For the abbreviations of the breeds, see supplementary table S1, Supplementary Material online.

