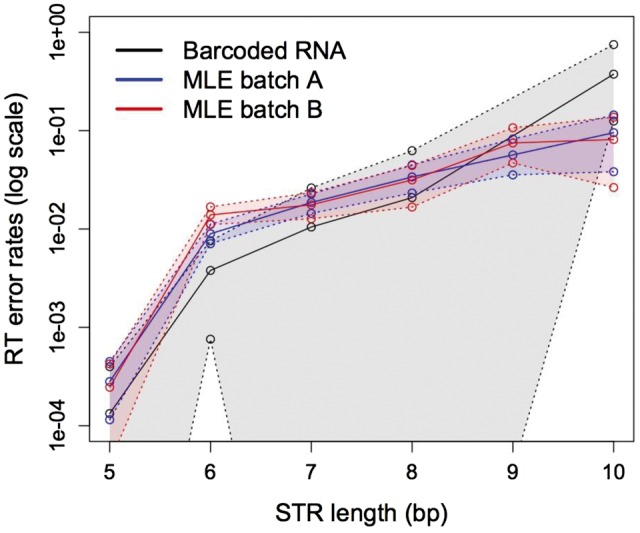
Fig. 3.

A comparison of RT error rates estimated using the full MLE (orangutan data) versus barcoded RNA sequencing (Caenorhabditis elegans data). The 95% confidence intervals for the rates estimated with the full MLE were generated from 100 empirical bootstrap replicates (bootstrapped across loci), whereas the 95% confidence intervals for the barcoded RNA sequencing were generated from 1,000 bootstrap replicates of inferred cDNA molecules with at least two cDNA molecules in that family. The lower bounds of the RT error rate confidence intervals for the barcoded RNA sequencing are zero and thus are outside the plotting area.
