
Figure 5.
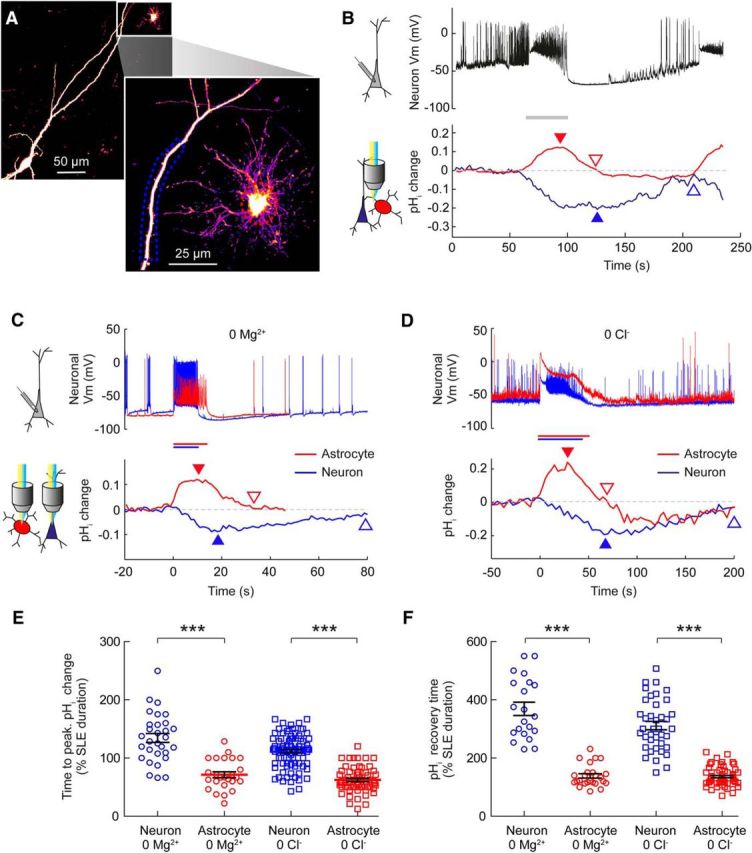
The kinetics of pH transients differ between astrocytes and neurons during epileptiform activity. A, A confocal image of a CA3 pyramidal neuron and neighboring astrocyte both expressing E2GFP. The expanded region shows a magnified view of the astrocyte and adjacent apical dendrite of the pyramidal neuron. Dashed boxes indicate regions of interest used for pH measurements. B, Current-clamp recording of a nearby neuron (somata <200 μm apart) provides a readout of 0 Mg2+-induced epileptiform activity (black trace). Simultaneous pH imaging from the regions of interest indicated by the dashed lines in A. The astrocyte (red) exhibited a transient increase in pH that was closely aligned with the SLE (gray bar), while the neuron (blue) exhibited a more prolonged decrease in pH. The arrowheads indicate the point of maximal pH shift (filled arrowheads) and the point at which pH recovered to baseline (empty arrowheads). C, Representative changes in intracellular pH during 0 Mg2+-induced epileptiform activity in an astrocyte (red traces) and a CA3 pyramidal neuron (blue traces) within the same hippocampal slice. The astrocyte exhibited a more rapid alkalinization, which peaked and then recovered more quickly than the more sustained acidification of the neuron. D, Similar differences in the kinetics of cell-specific pH shifts were observed when epileptiform activity was induced with 0 Cl− ACSF. E, Population data show that astrocytes reached their peak pH shift significantly faster than neurons in both 0 Mg2+ and 0 Cl−-induced epileptiform activity. F, The time for pH to recover to baseline was also significantly faster in astrocytes than neurons in both 0 Mg2+ and 0 Cl−-induced epileptiform activity. ***p < 0.0001, t test.