
Figure 7.
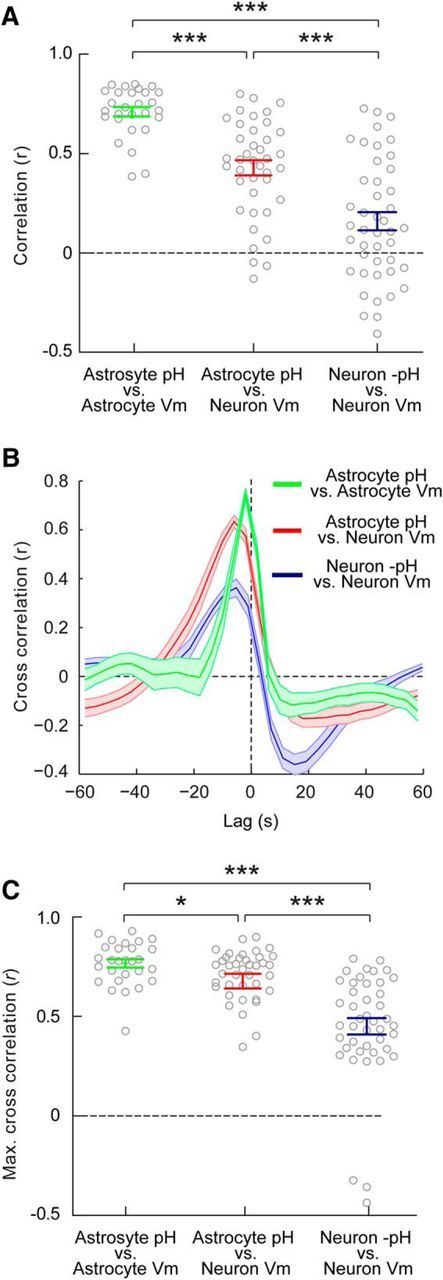
Astrocytic pH dynamics are more strongly coupled to network activity than neuronal pH dynamics. A, The absolute correlation between astrocytic pH and astrocytic membrane potential was highest (r = 0.71 ± 0.02), followed by the correlation between astrocytic pH and neuronal membrane potential (r = 0.43 ± 0.04), and the weakest correlation was observed between neuronal −pH and neuronal membrane potential (r = 0.15 ± 0.05). B, Cross-correlation analysis demonstrated that the maximum correlation between traces was observed when pH measurements were shifted with a negative lag, consistent with pH changes occurring in response to network activity. Shaded regions depict SEM. C, The highest cross-correlation values (calculated after shifting pH relative to membrane potential, as in B) were observed between astrocytic pH and astrocytic membrane potential (r = 0.77 ± 0.02). The next highest cross-correlation values were observed between astrocytic pH and neuronal membrane potential (r = 0.68 ± 0.02). These correlation values were both significantly greater than the cross-correlation values observed between neuronal −pH and neuronal membrane potential (r = 0.45 ± 0.04). *p < 0.05, ***p < 0.0001, t test.