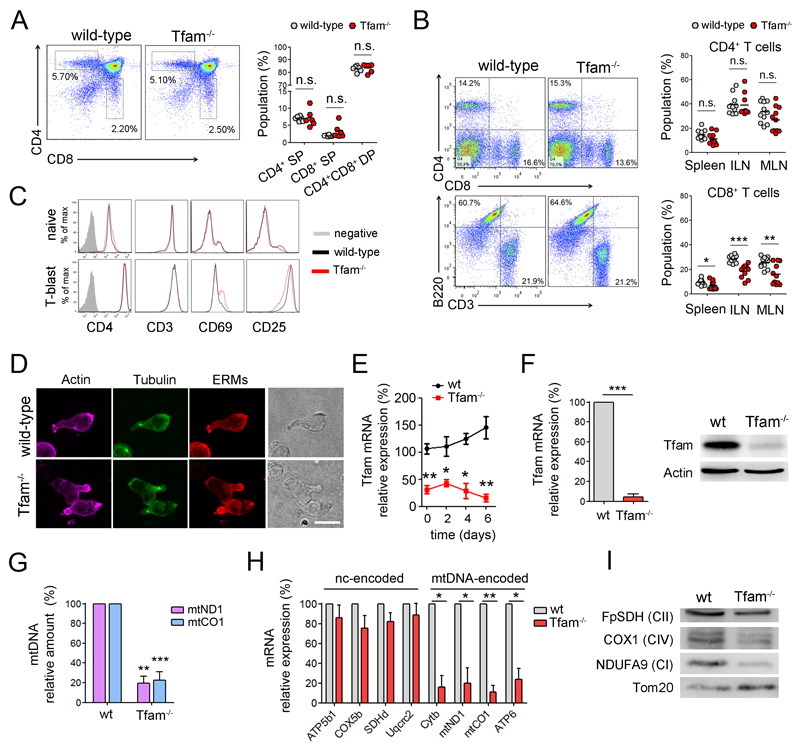
Figure 1. Tfam depletion induces severe mtDNA deficiency in T cells.
(A) Dot plots show CD4 and CD8 expression in thymocytes from wt and Tfam-/- mice. Right, percentage of CD4 and CD8 single positive (SP), and CD4/CD8 double positive (DP) cells. (B) Dot plots show CD4 and CD8 T cells, and CD3 and B220 cells from the spleens. Right, percentages of CD4 and CD8 cells in the spleen, inguinal (ILN) and mesenteric lymph nodes (MLN) (n=11). (C) Expression of cell surface markers in naive CD4 T cells and T-lymphoblasts differentiated with ConA (48 hr) and IL-2 (4 days). (D) Confocal images show the polarization of cytoskeletal components in T lymphoblasts by actin, tubulin and ERM (ezrin-radixin-moesin) staining. Scale bar represents 10μm. (E) Relative Tfam mRNA levels by RT-PCR in naive CD4 T cells (day 0) and during lymphoblast differentiation. (F) Tfam mRNA (left) and protein levels (right) in CD4 T lymphoblasts. (G) mtDNA levels (mtCO1 and mtND1) relative to nuclear DNA (SDH) in CD4 T lymphoblasts. (H) mRNA levels of mtDNA-encoded and genome-encoded mitochondrial subunits. (I) Immunoblot of T lymphoblast mitochondrial proteins. Complex I (CI) was detected with anti-NDUFA9, CII with anti-FpSDH, and CIV with anti-COX1. Tom20 was used as loading control. Data (B, E, F, G, H) are means ± SEM (n > 3); *p<0.05, **p<0.01 and ***p<0.001 (Student’s t-test).

