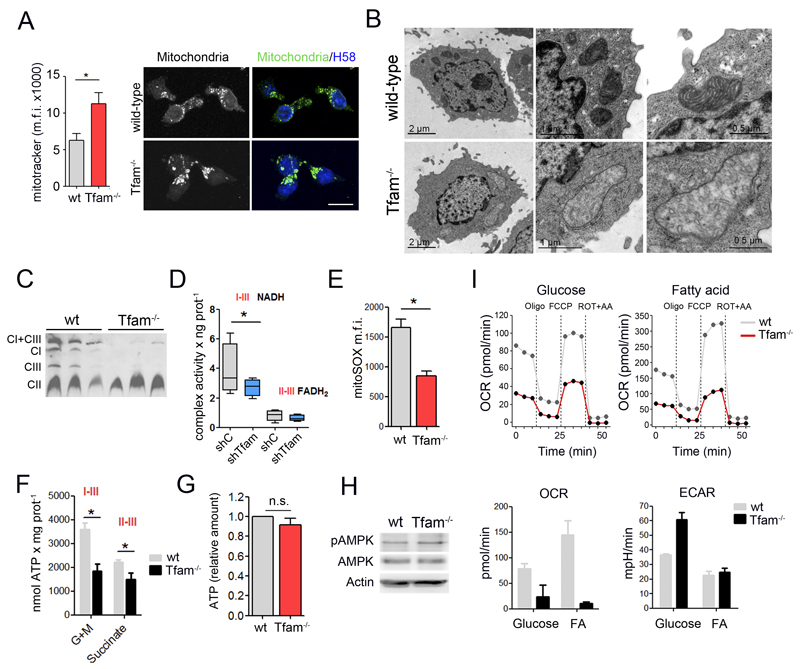
Figure 2. Tfam ablation induces OXPHOS deficiency in T cells.
(A) Left, flow cytometry analysis of Mitotracker staining. Right, confocal images of mitochondria (anti-MnSOD), and nuclei HOECHST58 (H58, blue) in T lymphoblasts. Scale bar represents 10μm. (B) Electron microscopy images in T lymphoblasts. (C) Blue-native gel electrophoresis analysis of electron-transport-chain complexes (detection of NDUFA9, FpSDH and Core1 for complexes I, II and III, respectively) from three wt and three Tfam-/- T cell lysates. (D) Combined mitochondrial complex activities in Jurkat T cells. Lines extending from the boxes indicate the variability outside the upper and lower quartiles. (E) Flow cytometry analysis of mROS in T lymphoblasts stained with MitoSOX. Data are presented as the mean fluorescence intensity. (F) Glutamate- and pyruvate-driven ATP-dependent production in Jurkat T cells. (G) Cellular ATP content in wt and Tfam-/- T cells. (H) Immunoblot analysis of AMPK phosphorylation at Thr172 in T lymphoblasts. Actin was used as a loading control. (I) CD3/CD28-activated CD4 T cells fed either with glucose or palmitate (FA) for 2 hr and oxygen consumption rate (OCR) and extracellular acidification rate (ECAR) measured in real time (upper panels). Lower panels show the basal OCR and ECAR from a representative experiment. Data (D, E, F, G) are means ± SEM (n ≥ 3, *p<0.05, Student’s t-test).

