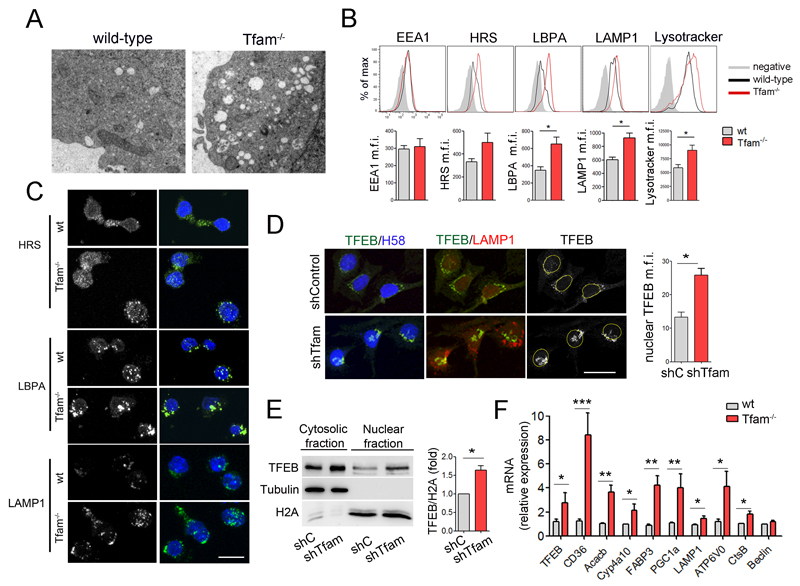
Figure 3. Tfam regulates lysosomal biogenesis through TFEB.
(A) Electron microscopy images show the abnormal intracellular accumulation of vesicles in Tfam-/- T lymphoblasts. (B) Flow cytometry analysis of EEA1, HRS, LBPA, LAMP1 and lysotracker content in CD4 T lymphoblasts. Results show mean fluorescence intensity (m.f.i.) (n=3). (C) Confocal images of HRS, LBPA, and LAMP1 in T lymphoblasts. Nuclei were stained with HOECHST58 (H58, blue). Scale bar represents 10μm. (D) Confocal images of TFEB (green), LAMP1 (red), H58 (blue) in Oli-Neu cells. Right, quantification of nuclear TFEB m.f.i. (E) Western blot analysis of TFEB subcellular location. Cytosolic and nuclear fractions of Jurkat cells were blotted for TFEB, tubulin, and histone 2A (H2A). Chart shows densitometry analysis of the ratio of nuclear TFEB to H2A (n=3). (F) Relative mRNA levels of TFEB and target genes in T lymphoblasts by RT-PCR (n=5). Data (B, D, E, F) are means ± SEM; *p<0.05, **p<0.01 and ***p<0.001 (Student’s t-test).

