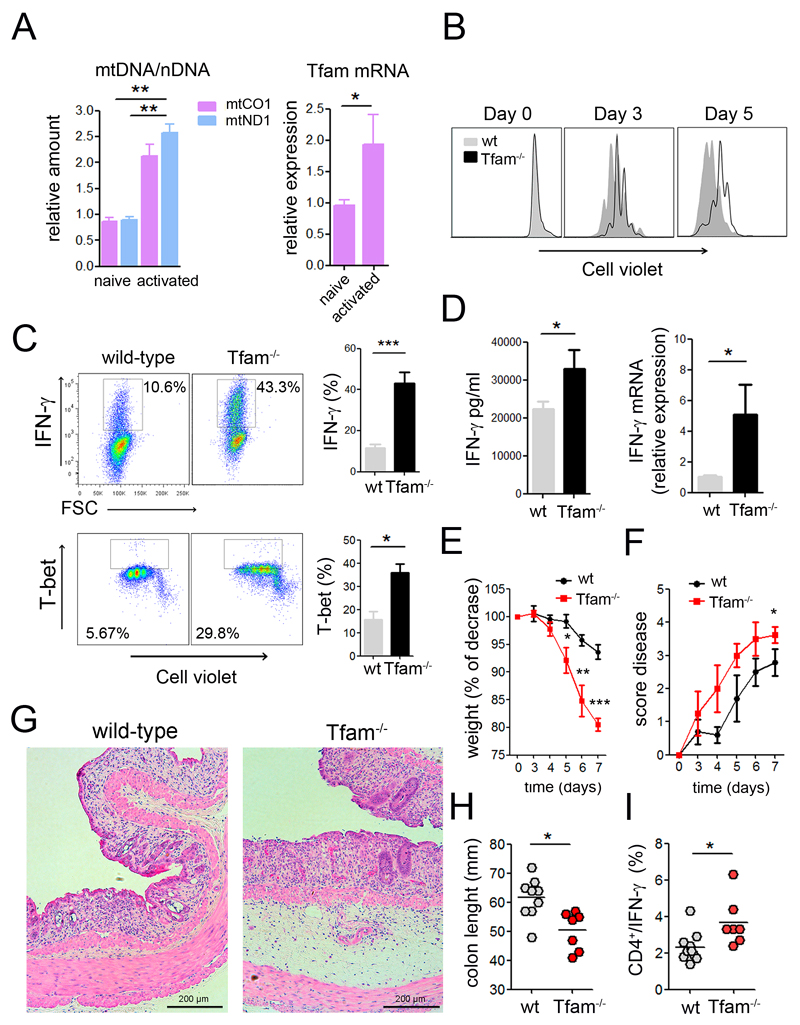
Figure 5. Inhibition of OXPHOS exacerbates inflammatory responses in vitro and in vivo.
(A) Relative mtDNA and Tfam mRNA levels in naive and CD3/CD28 activated CD4 T cells. (B) Cell proliferation analysis by Cell Violet dilution of CD4 T cells activated with CD3/CD28. (C, D) CD4 T cells were activated with CD3/CD28 (6 days), and IFN-γ and T-bet intracellular levels were measured by flow cytometry (C), IFN-γ secretion by ELISA and relative IFN-γ mRNA levels by RT-PCR (D). (E) Weight and (F) disease score were monitored for the indicated times in mice fed with 3% dextran sulfate sodium (DSS) in the drinking water. H&E staining of colon sections (G) and colon length (H) on day 7 after DSS treatment. (I) IFN-γproducing CD4 T cells in the mesenteric lymph nodes. Data are means ± SEM, (A, C, D, n≥3), (E-I, at least seven mice in two independent experiments); *p<0.05 and **p<0.01, ***p<0.001 (Student’s t-test).

