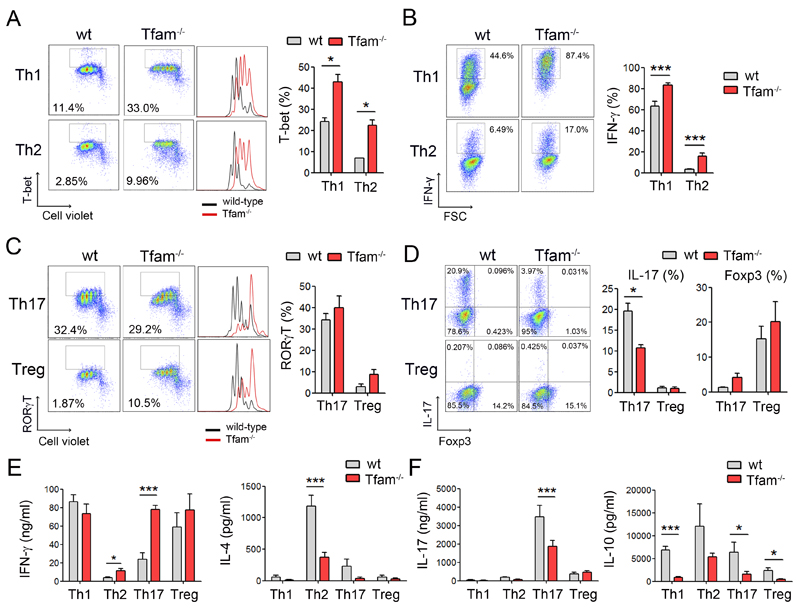
Figure 6. Mitochondrial dysfunction subverts T cell differentiation toward Th1 cell subsets.
(A) Cell Violet dilution and T-bet expression in CD4 T cells cultured under Th1 and Th2 conditions over 3 days. Chart shows percentage of T-bet expressing cells (n=3). (B) Intracellular flow cytometry analysis of IFN-γ-producing cells under Th1 and Th2 conditions over 6 days. Graph, quantification of IFN-γ-producing cells (n=6). (C) Naive CD4 T cells were cultured under Th17 and Treg conditions over 3 days. Dot plots show RORγT-expressing cells and histograms show cell proliferation assessed by Cell Violet dilution. Chart shows percentage of RORγT-expressing cells (n=3). (D) Intracellular flow cytometry analysis of CD4 T cells producing IL-17 and Foxp3. Chart shows percentage of IL-17 and Foxp3-producing cells (n=6). (E, F) Polarized CD4 T cells at day 6 were cultured in equal numbers in fresh medium followed by activation with PMA/ionomycin for 16 hr. Cytokines were measured by ELISA in the supernatants. Data are means ± SEM (n ≥ 3); *p<0.05, **p<0.01 and ***p<0.001 (Student’s t-test).

