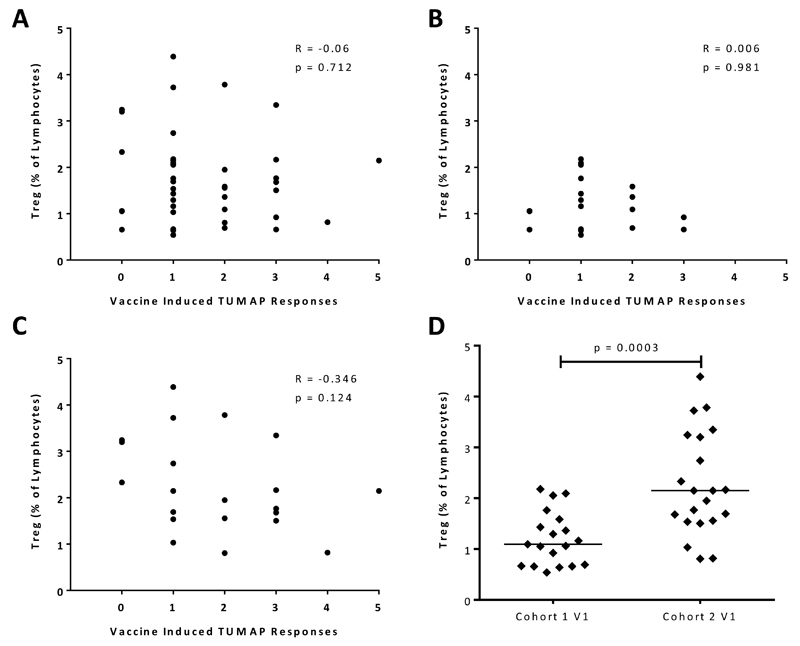
Figure 3. Correlation of pre-treatment levels of regulatory T cells with vaccine-induced immune responses to IMA950 TUMAPs.
Treg (CD4+/CD25hi/CD127lo/FoxP3+) levels, normalized to lymphocytes, at V1 were analyzed in correlation with vaccine-induced CD8 T-cell responses to IMA950 TUMAPs in (A) all immune evaluable patients with n=40, (B) study Cohort 1 with n=19 and (C) study Cohort 2 with n=21. Correlation coefficients and p-values, calculated using Spearman’s correlation, are indicated on each graph. (D) Cohort comparison of pre-treatment Treg levels on the first vaccination day for immune evaluable patients. For statistical analysis the Mann-Whitney test was used.
Abbreviations: Treg, regulatory T cells; TUMAP, tumor associated peptide; V1, vaccination 1.

