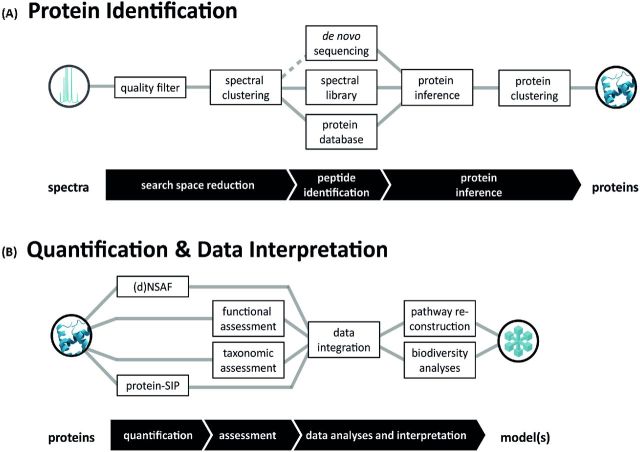
Figure 2.
From data to understanding. Schematic representation of workflows discussed in this review. Researchers can select or combine various methods for (A) data analysis, and (B) data interpretation (from top to down). Consecutive steps are connected by lines (dashed lines represent workflows not suitable for high-throughput analyses). Abbreviations are explained in the text.

