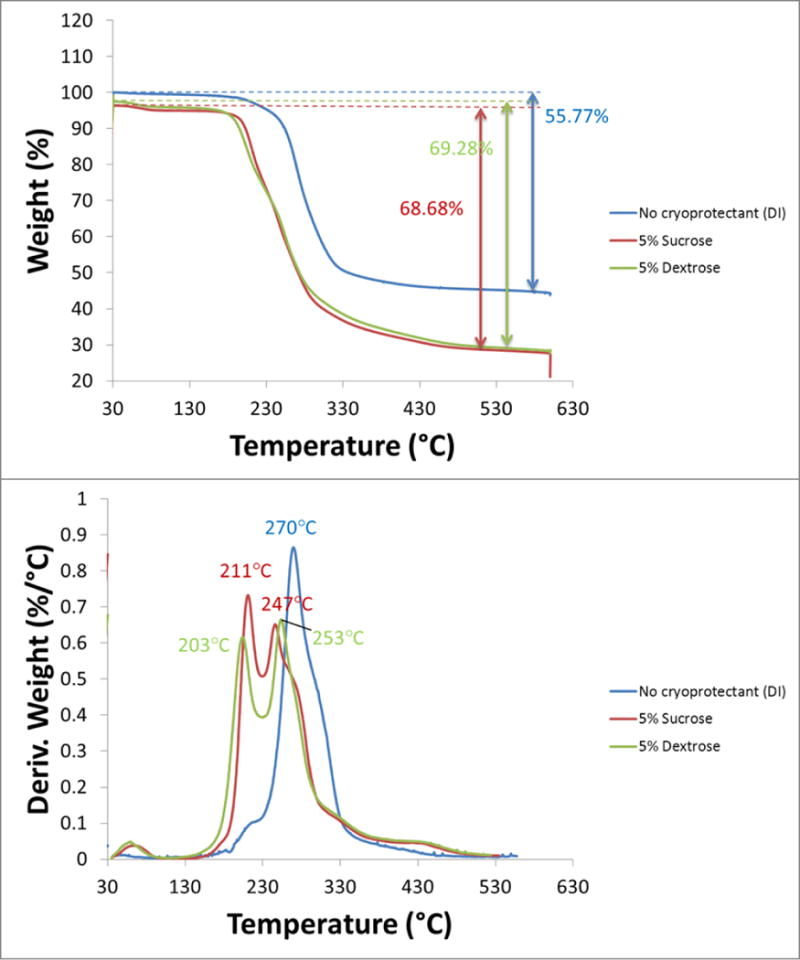
Figure 3.

TGA thermograms for PLGA encapsulated iron oxide NPs with no cryoprotectant (blue), 5% sucrose (red), 5% dextrose (green). The top graph plots the % weight as a function of temperature and shows the total percentage of PLGA polymer (and sugar if present) in the sample; the remaining weight at 600 °C is the magnetite. The bottom graph plots the magnitude of the weight % derivative as a function of temperature and highlights the temperature at which the PLGA polymer burns off. In the cryoprotected samples, there is an additional peak at ~200 °C highlighting the temperature at which the sugar burns off.
