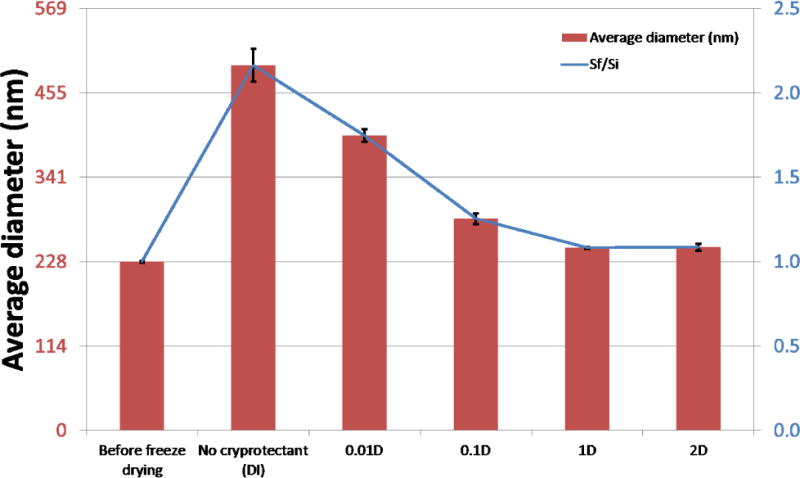
Figure 7.

Comparison charts of average particle sizes before freeze drying and after with and without cryoprotection. Top chart compares absolute average particle sizes. Bottom chart compares size ratios of particle size after freeze drying and initial particle size, Sf/Si.
