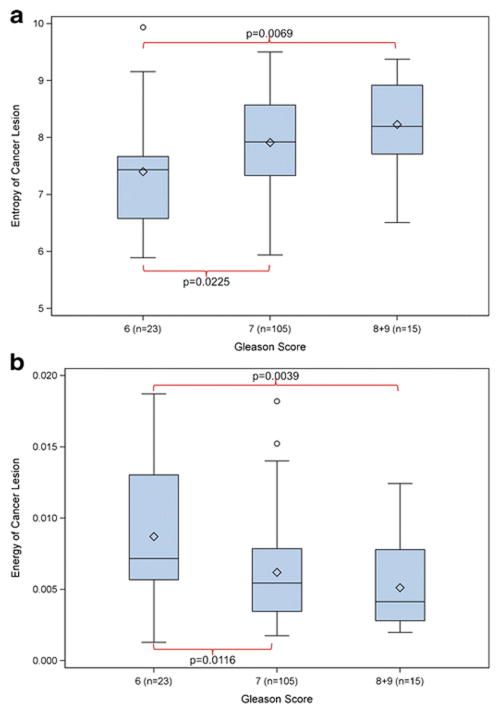
Figure 4.
Box-and-Whisker plots displaying the distribution of Haralick Entropy (A) and Energy (B) of peripheral zone prostate cancer lesions (n=143) on ADC maps, stratified by the lesions’ Gleason scores (3+3=6, 3+4=7 or 4+3=7, and >7). The detailed numbers and p-values are provided in Table 4.

