Figure 5.

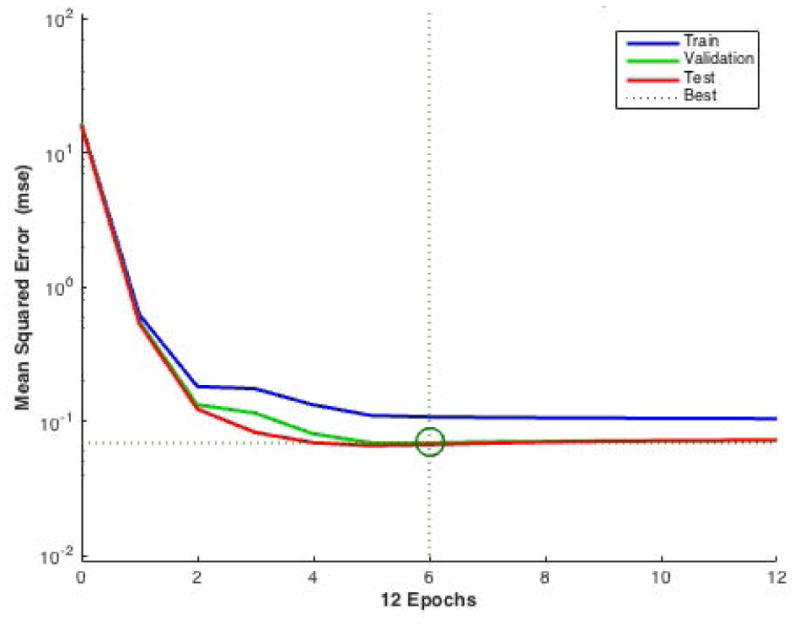
Performance of validation. The figure plots MSE versus the training epoch for all training (blue), validation (green), and test (red) data sets. The best validation performance point was circled in the figure (at epoch 6).

Performance of validation. The figure plots MSE versus the training epoch for all training (blue), validation (green), and test (red) data sets. The best validation performance point was circled in the figure (at epoch 6).